● Taiwan’s Key Economic Indicators (Data released before March 3, 2024)
 GDP Economic Growth Rate (yoy) 3.14 (%) 2025 forecast |
 CPI Change Rate 2.66 (yoy, %) Jan. 2025 |
 Unemployment Rate 3.30 (%) Jan. 2025 |
 Monthly Regular Earnings of All Employees (Industry and Services) 46,948 (NT dollars) Dec. 2024 |
- Consumer Price Index (CPI) for January 2025: The CPI rose by 0.55% compared to the previous month (December 2024). After adjusting for seasonal variations, it increased by 0.25%. Compared to the same month of the previous year (January 2024), it rose by 2.66%.
- Employment in January 2025: The number of employed persons was 11.619 million, an increase of 7,000 people or 0.06% compared to the previous month (December 2024). The number of unemployed persons was 396,000, a decrease of 3,000 people or 0.71% from the previous month. The unemployment rate was 3.30%, down by 0.02 percentage points from the previous month. After seasonal adjustment, the unemployment rate was 3.37%, a decrease of 0.01 percentage points from the previous month.
- Regular Wages for Full-Time Local Employees in Industry and Services (Excluding Foreign Nationals and Part-Time Workers) in December 2024: The average regular salary was NT$49,695, up by 0.52% month-on-month and 3.56% year-on-year. Non-regular wages, such as bonuses and overtime pay, averaged NT$15,177. The total average salary, including both regular and non-regular wages, was NT$64,872, reflecting a month-on-month increase of 10.37% and a year-on-year increase of 7.01%.
Source: Republic of China Statistical Information Network
● Statistics on Republic of China Nationals Traveling Abroad
| Outbound departures of nations in January-January-December 2024 16,849,683 |
| Year on Year +25.51% |
| Outbound departures of nations in December 2024 1,326,383 |
| Month on Month -0.03% |
Number of Trips and Growth Rate of Republic of China Nationals Traveling Abroad in December 2024 and from January to December 2024 –By Destination
Unit: Persons

★Source: Ministry of the Interior, Immigration Office (Republic of China).
Note: The outbound travel data for Republic of China nationals is based on the principle of counting the first destination reached by flight. Additionally, factors such as irregular chartered flight itineraries are included. Therefore, for the actual data on Taiwanese nationals traveling to specific countries, please refer to the official inbound statistics published by each destination country.
● Passenger Numbers of Cruise Ships at International Commercial Ports in the Taiwan Region
| Outbound departures of nations in January-December 2024 890,654 |
| Year on Year +183% |
| Outbound departures of nations in December 2024 74,274 |
| Month on Month +182% |

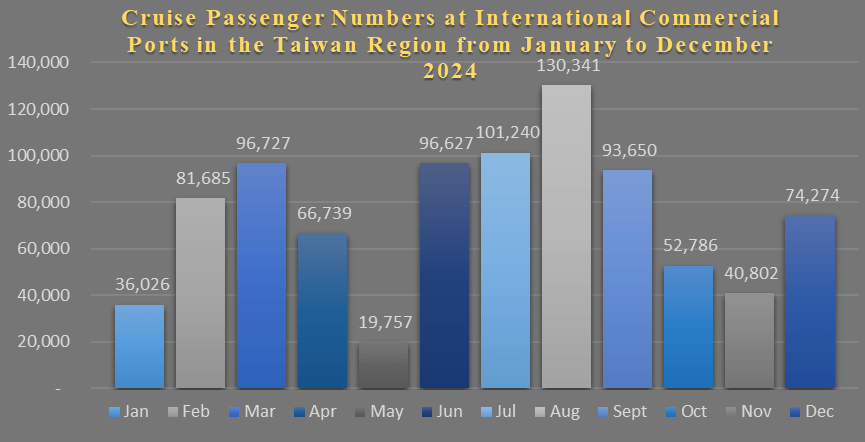
Source: Taiwan International Ports Corporation, compiled based on passenger entry and exit numbers reported by each port branch company.
★More Detailed Information:
● International Cruise Companies and Cruise Ships Stationed in Taiwan in 2025
| Affiliated Cruise Companies | Cruise Ships Operating in Taiwan | Tonnage | Passenger Capacity | Home Port in Taiwan |
| Costa Cruises | Costa Serena | 114,500 | 3,780 | Keelung Port/Kaohsiung Port |
| MSC Cruises | MSC Bellissima | 172,000 | 5,686 | Keelung Port |
| Norwegian Cruise Line | Norwegian Encore | 75,338 | 2,018 | Keelung Port |
| Star Cruises | Star Navigator | 75,338 | 1,856 | Keelung Port |
Latest Voyage Statistics of International Cruise Companies in Taiwan from 2023 to 2025

The Statistics of Monthly Sailings of Each Cruise Line from 2025

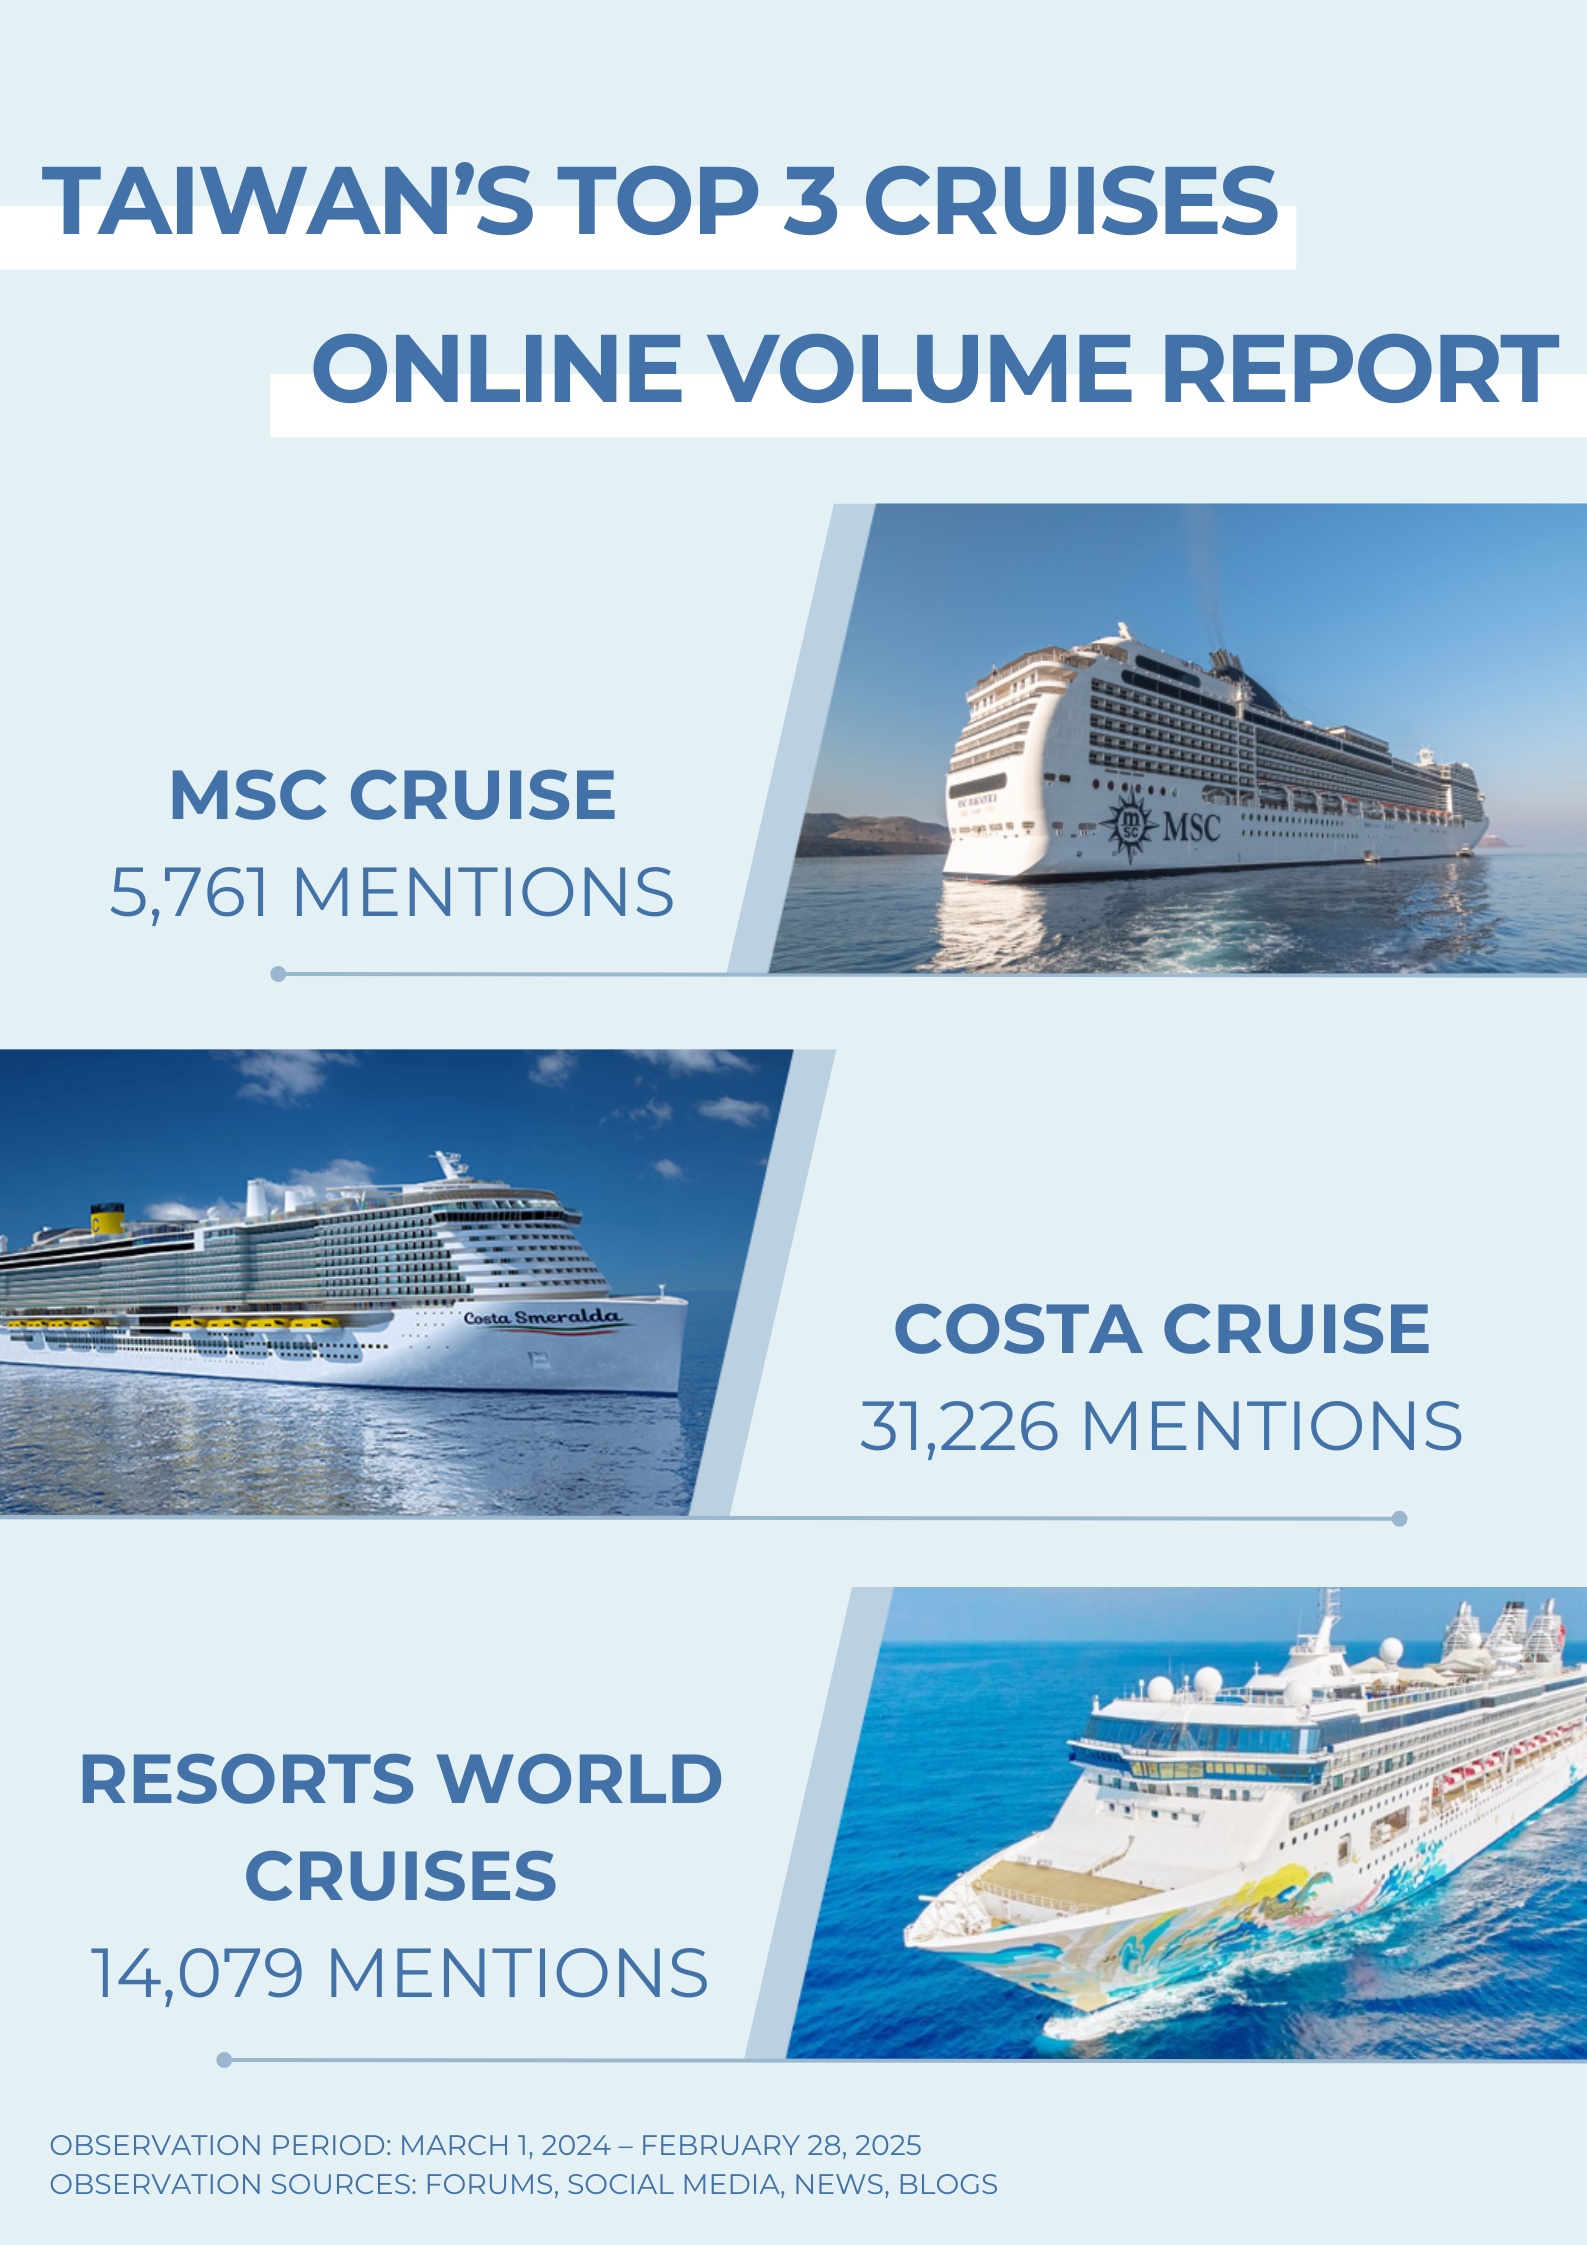
● Online Volume Report of Taiwan’s Top Three Popular Cruise Ships
According to statistics from the Taiwan International Ports Corporation (TIPC), the total cruise passenger volume across Taiwan’s ports in 2024 was approximately 900,000, with foreign passengers accounting for 35% –a figure higher than the 31% recorded before the pandemic. Looking ahead to 2025, TIPC projects that Taiwan’s ports will welcome 618 cruise ship visits, with passenger numbers expected to reach 925,000.
Overall, Taiwan’s cruise tourism market exhibited a strong recovery in 2024, and with the promotion of diverse routes and products, it is poised to attract even more travelers in 2025.
This online buzz analysis focuses on cruises, first examining the overall online buzz surrounding cruise tourism, followed by a comparison of three popular cruise brands: MSC Cruises, Costa Cruises, and Resorts World Cruises. The analysis covers their online sentiment volume, number of discussions, and composition of buzz.

Observation Period: March 1, 2024, to February 28, 2025
Observation Sources: Discussion forums, social media websites, news, blogs
Note: This online insight analysis is based on data from the OpView Social Media Reputation Database, with statistics reflecting the number of online discussions related to “cruise tourism.”
● Overview
Over the past year, the total online buzz for “cruise tourism” amounted to 246,661 mentions, with the primary source being “social media websites,” accounting for 83.78%. The gender distribution of the buzz was 59.4% male and 40.6% female. Additionally, this group of people interested in cruise tourism also showed particular interest in related topics such as travel accommodations, lifestyle sharing, news, food, parenting and education, knowledge sharing, and consumerism.

● Breakdown of Online Buzz Sources:
●Social media websites: 206,656 mentions (83.78%)
●News: 27,939 mentions (11.33%)
●Discussion forums: 10,485 mentions (4.25%)
●Blogs: 1,581 mentions (0.64%)
●Peak Buzz in July: The highest spike in buzz came from a social media giveaway event related to 2024 cruise travel plans, featuring prizes such as a luxurious Singapore cruise and accommodation vouchers.
Most Popular Post: ✨2024 Special Project [Set Sail! TRAVELER Luxe Cruise Traveler] Enter Now to Win Big Prizes! 🎁
https://www.facebook.com/100064317384478/posts/853021100185128/
● Comparison of Online Buzz for MSC Cruises, Costa Cruises, and Resorts World Cruises

●MSC Cruises: Total buzz of 5,761 mentions, with the highest annual peak occurring in December of the previous year. Some articles highlighted the advantages of family-oriented New Year’s events and cruise travel, particularly catering to the demand for family trips at year-end and during spring. The most buzz-generating post was an interactive, family-themed post on a Facebook fan page, which received high positive sentiment.
●Costa Cruises: Total buzz of 31,226 mentions, with the highest annual peak in July. The primary reason was significant discussion on social media triggered by itinerary changes. Additionally, promotional campaigns and discounts for summer voyages garnered widespread attention. Overall, Costa Cruises’ brand image has faced challenges due to recent events, but the high online buzz has also brought substantial visibility.
●Resorts World Cruises: Total buzz of 14,079 mentions, with the highest annual peak also in July. Articles mainly focused on giveaway events and promotional campaigns for cruise itineraries, especially family-friendly trips with attractive pricing that drew significant sign-ups. Furthermore, social media posts from users sharing real experiences and photos of their cruise journeys –highlighting the convenience and enjoyment of cruise travel –sparked resonance and discussions among other netizens, resulting in the highest positive sentiment among the three brands.
● Insights into Online Buzz Sources
The four main sources of online buzz, ranked by proportion, show social media websites accounting for the highest share, followed by news, discussion forums, and blogs.

●MSC Cruises: Among the three brands, MSC Cruises has the highest proportion of buzz from news sources (29.06%) and a relatively lower proportion from social media websites (66.34%). Over the past year, news coverage of MSC Cruises has primarily focused on the launch of new ships and routes, eco-friendly green technology, the post-pandemic recovery of cruise tourism, and travel safety measures.
●Costa Cruises: Costa Cruises has the highest proportion of buzz from social media websites among the three (85.74%), with discussions centered on several key topics: traveler reactions to itinerary changes and their handling, cruise promotional campaigns, summer voyage sign-ups, and exchanges of passenger experiences aboard Costa Cruises.
●Resorts World Cruises: Similarly, Resorts World Cruises has the highest proportion of buzz from social media websites (82.34%), with a total of 11,761 mentions. For a brand newly entering the Taiwan market, its online buzz performance is notably impressive. Positioning itself as “the cruise line that best understands Taiwanese people,” Resorts World Cruises has garnered a significant level of online resonance.
● Insights into Cruise Tourism Focus Keywords –Word Cloud
This cruise tourism word cloud highlights several core topics of interest to travelers, primarily revolving around cruise, passengers, itinerary, and voyage.
From a travel destination perspective, terms like Okinawa, Miyako Island, Ishigaki Island, and Kyushu represent popular Asian routes, while Kaohsiung Port, Keelung Port, and Maritime Port Bureau reflect the main departure ports.
In terms of travel experience, words such as food, restaurants, attractions, and holiday underscore travelers’ emphasis on dining and sightseeing activities onboard. Terms like cruise market, cruise products, and cruise industry indicate attention to the economic and developmental aspects of the cruise sector, while voyage pandemic reflects the impact of the pandemic on the cruise industry.
Additionally, MSC, Costa, and Serena (referring to Costa Serena) are prominent cruise brands, showing that brand consideration plays a role in travelers’ choices. Words like travel agency, tour package, and features highlight the importance of cruise itinerary planning to passengers.
★Cruise travel_text cloud


● Nationwide Travel Frenzy: Last Year’s Travel Deficit Hits Record High of Over $10 Billion
The Central Bank of the Republic of China released the balance of payments statistics for the fourth quarter of last year, revealing several records for the full year. These include the second-highest current account surplus in history, the highest goods trade surplus ever, the highest primary income surplus ever, and the highest net financial account direct investment assets in history. This reflects robust activity in exports, overseas investments by domestic firms, and overseas investments by Taiwanese nationals.
/ Expand full text /
Notably, the annual travel expenditure reached $20.063 billion, the second-highest in history, surpassed only by 2019. Travel income was $9.692 billion, resulting in a travel deficit of $10.401 billion –the largest ever recorded.
On a quarterly basis, the current account surplus in the fourth quarter of last year was $34.40 billion, with net financial account assets increasing by $30.70 billion and the central bank’s reserve assets rising by $4.14 billion. The central bank further explained that the goods trade surplus in the fourth quarter was $26.32 billion, a year-on-year decrease of $3.70 billion, primarily due to increased imports driven by manufacturers stockpiling materials in response to export-derived demand, with import growth outpacing export growth. The services balance recorded a deficit of $1.99 billion, up $140 million year-on-year, mainly due to increased travel expenditure.
● Revenge Travel Boom Continues: IATA Forecasts Air Passenger Numbers to Exceed 5 Billion in 2025
The International Air Transport Association (IATA), a global civil aviation organization, recently stated that air passenger numbers are projected to surpass 5 billion for the first time in 2025, with the aviation industry’s revenue expected to break the trillion-dollar mark in the same period.
/ Expand full text /
In its statement, IATA noted: “Passenger numbers in 2025 are estimated to reach 5.2 billion, a 6.7% increase from 2024, marking the first time they will exceed the 5 billion threshold.”
The statement further highlighted that, bolstered by falling fuel prices, the aviation industry’s total revenue is projected to reach $1.007 trillion (approximately NT$32 trillion), “marking the first time aviation revenue surpasses the $1 trillion milestone,” representing a 4.4% increase from 2024.
IATA Director General Willie Walsh remarked in the statement that despite “ongoing supply chain challenges, inadequate infrastructure, cumbersome regulations, and the burden of increasing taxes,” IATA estimates the aviation industry’s profits to reach up to $36.6 billion in 2025.
● Malaysia Promotes 2026 Tourism Year, Boosts Cross-Border Tourism in Border Cities
Last year, Malaysia welcomed 38 million international visitors, solidifying its position as a key tourism destination in Southeast Asia. To achieve its goals for the 2026 Malaysia Tourism Year, the country will enhance business travel and cross-border tourism in border cities this year, sharing its local stories, culture, and hospitality with the world.
/ Expand full text /
The Ministry of Tourism, Arts and Culture (MOTAC) held a press conference before the Lunar New Year this year to launch the “2026 Malaysia Tourism Year” campaign. Yesterday, on the first day of the Lunar New Year, the Malaysia Tourism Promotion Board greeted arriving international travelers at airport terminals in Kuala Lumpur, Penang, Sabah, and Sarawak, offering New Year greetings and distributing festive gifts.
According to reports from New Straits Times, Oriental Daily News, and other media outlets, the Tourism Promotion Board will intensify efforts to promote business travel and “border tourism,” aiming to establish Malaysia as one of the leading tourism destinations within the Association of Southeast Asian Nations (ASEAN).
● January Visitor Numbers to Japan Surge 40%, Setting Record High; Taiwan Breaks Records
The Japan National Tourism Organization (JNTO) announced on the 19th that, driven by the Lunar New Year holiday and heightened travel demand, the number of foreign visitors to Japan in January 2025 surged by 40.6% compared to the same month last year, reaching 3,781,200. This marked the 20th consecutive month with over 2 million monthly visitors and the 4th consecutive month exceeding 3 million, far surpassing the 3,489,800 recorded in December 2024. This figure set a new single-month record since statistics began in 1964.
/ Expand full text /
For the full year of 2024, the number of foreign visitors to Japan increased by 47.1% to 36,869,900, exceeding the 31,882,049 recorded in 2019 and establishing a new annual historical high.
According to statistics released by the Japan Tourism Agency on January 15, the depreciation of the yen, a significant increase in foreign visitors, and rising accommodation costs drove foreign visitor spending in 2024 to 8.1395 trillion yen –a 53.4% surge compared to 2023. This marked the first time annual spending exceeded 8 trillion yen, far surpassing the 5.3065 trillion yen recorded in 2023 and setting a new historical record.
● Taiwan Ranks as Vietnam’s Third-Largest Visitor Source, with 1.28 Million Trips, Up 51% Year-on-Year
In 2024, Vietnam welcomed nearly 17.6 million international visitors, with Taiwan emerging as the third-largest source of international travelers to the country. The number of Taiwanese visitors exceeded 1.28 million, reflecting a year-on-year increase of approximately 51%. Industry experts attribute this growth to the significant impact of Vietnam’s introduction of electronic visas for Taiwanese travelers.
/ Expand full text /
According to statistics from the Vietnam National Tourism Administration, Vietnam received 17.58 million international visitors in 2024, a year-on-year increase of nearly 40%. Compared to 2019, before the COVID-19 pandemic, this figure represents a 98% recovery, successfully meeting the annual target of 17 to 18 million visitors.
Further data analysis reveals that in 2023, approximately 851,000 Taiwanese traveled to Vietnam, and this number grew by about 51% in 2024 to 1.288 million. Industry observers note that the significant increase in Taiwanese visitors is largely driven by Vietnam’s policy of opening electronic visas to Taiwanese nationals starting in mid-August 2023.
※CheeseAd is an advertising agency specializing in serving clients in the tourism industry. To better understand the current state of tourism in Taiwan for our foreign clients, we have selected news or information from your platform. If you have any comments regarding the above excerpts, please feel free to contact us. Thank you!

Key Summary
- As consumers increasingly shift from traditional television to streaming media, the Connected TV (CTV) advertising market continues to grow, becoming a critical battleground for brand marketing.
- According to The Trade Desk’s 2024 Taiwan Connected TV Trends White Paper released at the end of 2024, the rise of streaming services has driven LINE TV to reach 5 million monthly active users. Platforms like LiTV and Kbro Broadband are closely following, while 4gTV and KKTV have achieved an average of 1 million monthly visits. By 2027, Taiwan’s CTV advertising revenue is projected to grow at an annual rate of 14%, reaching $776 million.
- According to a 2024 forecast by digital market research firm eMarketer, the number of connected TV viewers in the United States has surpassed traditional cable TV audiences, prompting a significant shift in corporate advertising budgets toward CTV.
● The Ultimate Evolution of TV Advertising! How CTV is Revolutionizing the Future Marketing Landscape?
★ What is CTV?
CTV advertising (Connected TV Advertising) refers to digital advertisements delivered on Connected TV (CTV) devices. CTV encompasses television devices connected to the internet, such as Smart TVs, streaming devices (e.g., Apple TV, Google Chromecast, Amazon Fire Stick), or gaming consoles (e.g., PlayStation, Xbox). Through these devices, users can access streaming content, including platforms like Netflix, YouTube, Disney+, and more.

★ Why Are More People Abandoning Traditional TV? CTV is Rewriting the Rules of Advertising!
Traditional television is constrained by factors such as fixed schedules, geographic limitations, excessive commercials, and restricted content, driving consumers toward the flexibility, personalization, and on-demand nature of streaming media. The rise of digital technology has empowered consumers to freely access content they’re interested in across various screen sizes and devices, shattering the reliance on linear TV entertainment. The barriers to content are now reduced to language and culture, with no boundaries or time restrictions.
As technological advancements continue and content competition intensifies, this shift will keep accelerating, propelling the CTV advertising market toward explosive growth.

Source: DMA (Digital Media Application and Marketing Association of Taiwan)
White Paper on Changes in Consumer Behavior and the Development of the Commercial Ecosystem for Connected TV (CTV) in Taiwan
● CTV Advertising Set to Surpass Traditional TV, Reaching a Critical Turning Point in 2028!
According to eMarketer’s projections, CTV advertising investment will reach $33.35 billion in 2025, with 98.4% of that amount allocated to video ads. eMarketer also forecasts that the CTV advertising market will expand rapidly at a steady double-digit annual growth rate, reaching $46.89 billion by 2028. At that point, CTV advertising investment is expected to surpass traditional TV advertising for the first time, with the latter projected to decline to $45.10 billion. Despite the rapid growth of the CTV advertising market, Meta’s video ad investment is projected to reach $48.77 billion in 2026, exceeding the total CTV ad investment of $37.70 billion by over $10 billion. This indicates that the CTV advertising market still lags behind social media in scale.
Furthermore, in 2026, only three companies are expected to account for more than 10% of CTV ad sales. These companies are YouTube, Amazon, and Disney. YouTube is projected to generate $9.21 billion in CTV ad revenue in 2026, representing 24.4% of the year’s total CTV ad market and a net profit share of 11.9%. However, even with its total cross-device video ad revenue reaching $10.28 billion, this amount is only about a quarter of Meta’s video ad revenue (approximately 21.1%) for the same year. Amazon’s CTV ad revenue is also expected to exceed 10%, driven primarily by Amazon Prime Video and Fire TV, with additional contributions from Twitch and Freevee. When combining the Disney group’s Hulu, ESPN, and Disney+ platforms, its CTV ad sales share is projected to exceed 10% in 2026, with Hulu and Disney+ together accounting for 10.8%.
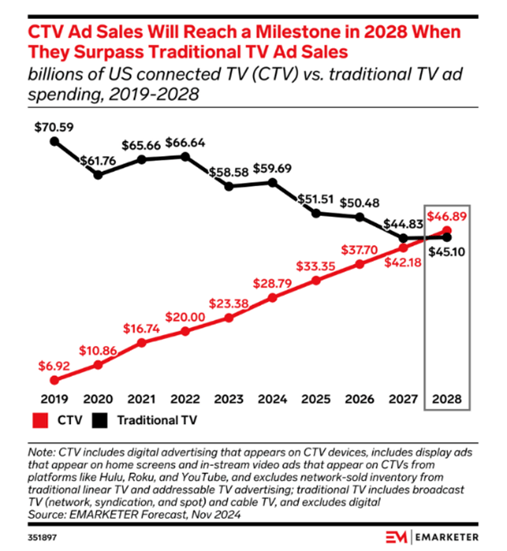
Image: Provided by eMarketer
Source: Taiwan Publisher Group
Facebook Video Ads Outperform CTV’s Power Alliance – TPG Weekly Issue 147
● The Rise of Streaming Sparks an Advertising Revolution, Fully Ushering in the CTV Era!
★ Four Key Advantages Drive Growth, with Nearly Half of Advertisers Planning to Increase CTV Ad Budgets in the Next Year!
Research shows that beyond the shift of younger audiences toward CTV platforms, what truly attracts marketers to CTV are its four key advantages:
- Delivering a higher-quality, personalized ad experience
- Enabling the creation of a more comprehensive omnichannel strategy
- Offering premium, professionally produced content
- Providing precise tracking and measurement of campaign performance
These factors contribute to generating higher advertising returns for brands. As a result, most marketers view the effectiveness of CTV advertising positively. Data indicates that within the next year, 46% of brands or agencies plan to increase their CTV advertising budgets. Among these, an impressive 62% of respondents intend to boost their budgets by more than 50%, with 9% even anticipating increases exceeding 100%. This demonstrates that allocating resources to CTV advertising is becoming mainstream, with brands expecting CTV to deliver greater positive impacts on brand image and marketing campaigns.

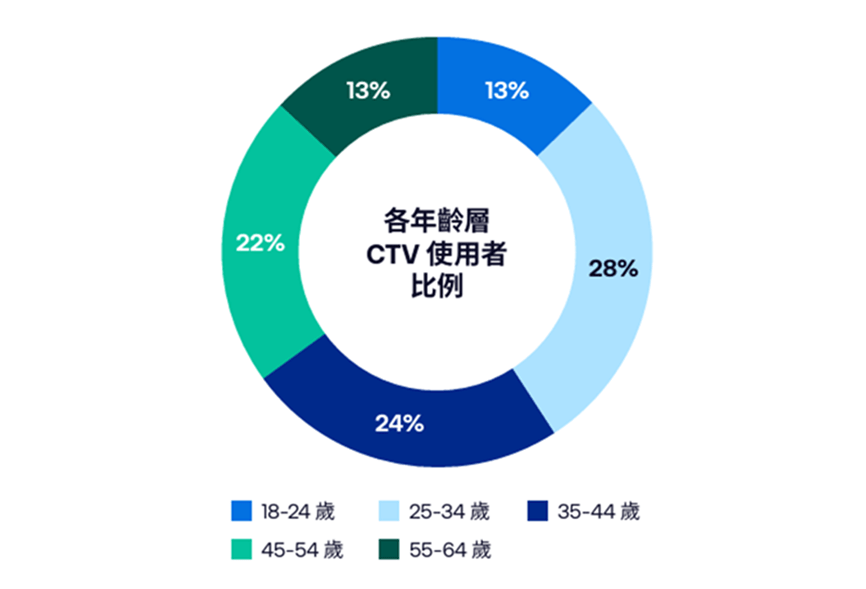
★ Capturing the Attention of Millennials, Streaming Video Fuels Double-Digit Growth in CTV Ad Revenue
One of the key drivers behind the rapid growth of Taiwan’s CTV market is the expanding audience of younger viewers. The on-demand entertainment features offered by CTV are indispensable for consumers accustomed to accessing their favorite content “anytime, anywhere.” Research reveals that 52% of CTV users belong to the 25-44 age group –Millennials (Generation Y) –making them the largest core audience for CTV. As this demographic also represents the primary source of current consumer spending power, brands that precisely target CTV channels for marketing investments can achieve long-term, effective results.
The growing popularity of streaming media services is another major factor propelling the booming development of Taiwan’s CTV/OTT market. Among numerous local platforms, LINE TV leads with 5 million monthly active users, followed closely by LiTV and Kbro Broadband. Meanwhile, 4gTV and KKTV each boast an average of 1 million monthly visits. The diverse and rich array of streaming platform options further boosts the growth potential of the CTV advertising market.
In summary, over the next few years, social media video advertising and the CTV advertising market are expected to continue their rapid growth, emerging as key areas for advertising investment. This presents new opportunities for advertisers and marketers.
However, as market competition intensifies, marketers will need to balance cost and value while adopting innovative strategies to achieve success in this emerging field.

Concept Proposal:
How incredible is Saga’s natural environment? “Food” is the ultimate proof! From Saga beef and Imari beef to the bamboo crabs, oysters, and seaweed from the Ariake Sea, Saga transforms its exceptional ingredients into extraordinary cuisine! Dishes range from refreshing carp preparations and melt-in-your-mouth tofu soup to century-old traditions like Susu sushi and Ogi yōkan, alongside specialties such as Saga Sicilian rice, Saga ramen, and Marubouro sweets. These delights ensure that both adventurers and foodies can’t stop eating, creating the most delicious memories of a Saga journey.
● Tigerair Taiwan x Saga Prefecture Tourism Federation x Kyushu Saga International Airport: “Savor Saga Bistro”
★ Promote Saga’s gourmet food and sake, turning all of Saga into a grand bistro and inviting consumers to dine. The website serves as a virtual restaurant, offering a menu for consumers to explore. It introduces main courses (Saga cuisine), desserts (Saga sweets), paired drinks (Saga sake), and dining ambiance (Saga’s scenic beauty). Visitors can create their personalized Saga menu and have a chance to win vouchers for Saga restaurants, encouraging them to visit Saga in person to enjoy its culinary delights.

My Savor Menu –Main Course / Saga Cuisine

My Savor Menu –Dessert / Saga Sweets

My Savor Menu –Paired Drink / Saga Sake

My Savor Menu –Dining Area / Saga Scenic Beauty

Share My Savor Menu

Saga Local Restaurant Voucher