● Key Economic Indicators of Taiwan (Data released before May 13, 2024)
 GDP Economic Growth Rate (yoy) 3.14 (%) 2025 forecast |
 CPI Change Rate 2.03 (yoy, %) April. 2025 |
 Unemployment Rate 3.35 (%) Mar. 2025 |
 Monthly Regular Earnings of All Employees (Industry and Services) 47,525 (NT dollars) Mar. 2025 |
- In April 2025, the Consumer Price Index (CPI) rose by 0.27% compared to the previous month (March). After adjusting for seasonal factors, it increased by 0.05%. Compared to the same month in the previous year (April 2024), it rose by 2.03%. On average, from January to April, the CPI increased by 2.15% compared to the same period last year. In April 2025, the Producer Price Index (PPI) decreased by 0.96% compared to the previous month but increased by 0.93% compared to the same month last year. On average, from January to April, the PPI rose by 3.02% year-on-year.
- In March 2025, the number of employed persons was 11.61 million, a decrease of 6,000 persons or 0.05% from the previous month. The number of unemployed persons was 403,000, an increase of 1,000 persons or 0.21% from the previous month. The labor force participation rate was 59.31%, down 0.02 percentage points from the previous month. The unemployment rate was 3.35%; after seasonal adjustment, it was 3.36%, both rising by 0.01 percentage points compared to the previous month.
- In March 2025, the average regular earnings of all employed persons (including full-time and part-time employees of both domestic and foreign nationalities) were NT$47,525, reflecting a monthly increase of 0.46% and an annual increase of 3.15%. Non-regular earnings, including bonuses and overtime pay, averaged NT$7,598. The combined average total earnings were NT$55,123, representing a monthly decrease of 5.05% but an annual increase of 3.09%. The median regular earnings were NT$38,111, up 0.28% from the previous month and up 3.03% from the same month last year.
Source: National Statistics, Republic of China (Taiwan)
● Statistics on Republic of China Nationals Traveling Abroad
| Outbound departures of nations in January – February 2025 3,029,248 |
| Year on Year +13.4% |
| Outbound departures of nations in February 2025 1,415,766 |
| Month on Month -12.3% |
Number of trips and growth rate of Republic of China nationals traveling abroad in February 2025 and from January to February 2025 –By destination
Unit: Persons
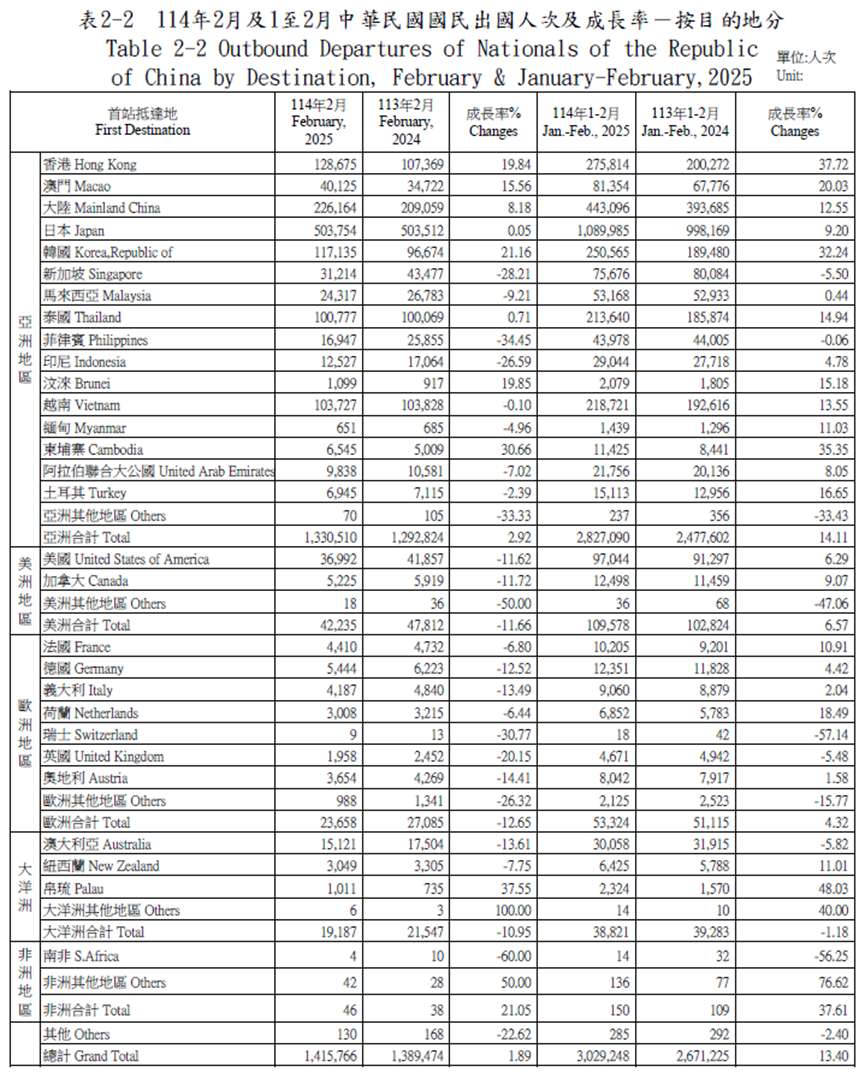
★Source: Ministry of the Interior, Immigration Office (Republic of China)
Note: The outbound travel data for Republic of China nationals is based on the principle of counting the first destination reached by flight. Additionally, factors such as irregular chartered flight itineraries are included. Therefore, for the actual data on Taiwanese nationals traveling to specific countries, please refer to the official inbound statistics published by each destination country.
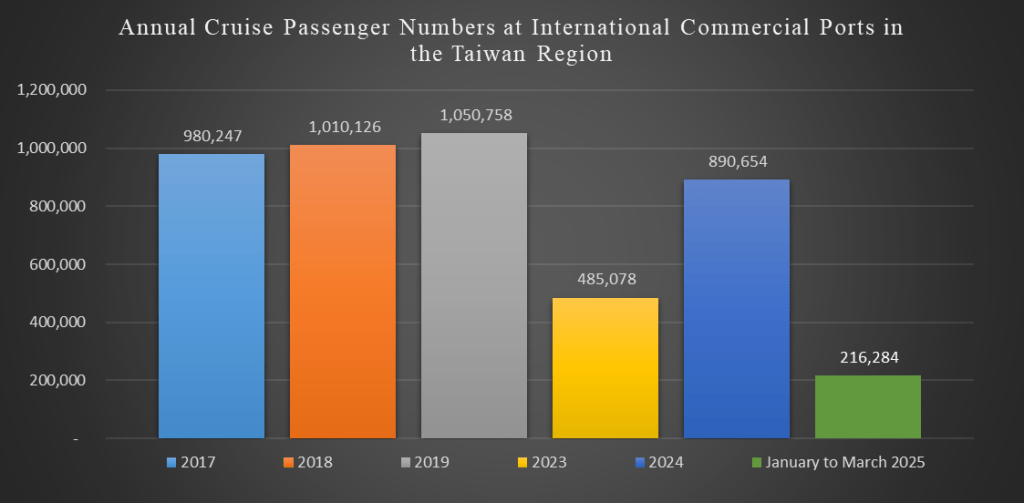
● Passenger Numbers of Cruise Ships at International Commercial Ports in the Taiwan Region
| Outbound departures of nations in January-March 2025 216,284 |
| Year on Year +100.9% |
| Outbound departures of nations in March 2025 123,144 |
| Month on Month +182% |

| Affiliated Cruise Companies | Cruise Ships Operating in Taiwan | Tonnage | Passenger Capacity | Home Port in Taiwan |
| Costa Cruises | Costa Serena | 114,500 | 3,780 | Keelung Port/ Kaohsiung Port |
| MSC Cruises | MSC Bellissima | 172,000 | 5,686 | Keelung Port |
| Norwegian Cruise Line | Norwegian Spirit | 75,338 | 2,018 | Keelung Port |
| Star Cruises | Star Navigator | 75,338 | 1,856 | Keelung Port |

Last Voyage Statistics of International Cruise Companies in Taiwan from 2023 to 2025

Top 5 Popular Tourist Attractions in Hong Kong –Online Buzz Analysis
● Overview
Observation Period: May 1, 2024, to April 30, 2025
Observation Sources: Discussion forums, social media websites, news, blogs
Note: This online insight analysis is based on data from the OpView Social Media Reputation Database, with statistics reflecting the number of online discussions related to “tourist attractions in Hong Kong.”
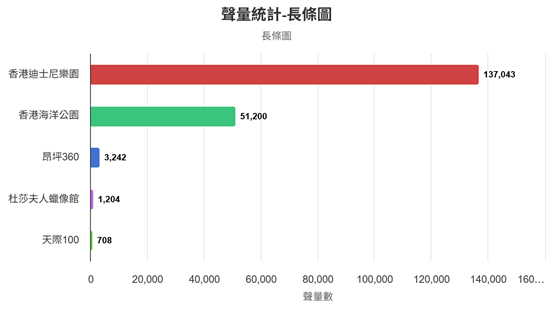
Based on the analysis of the pie chart and bar graph, among the top five popular tourist attractions in Hong Kong, Hong Kong Disneyland generated the highest online buzz, with a total of 137,043 mentions, accounting for 70.9% of the total. As a representative landmark of Hong Kong tourism, its strong appeal to visitors can be attributed to recent collaborative new attractions, vibrant parades, and spectacular fireworks shows, making it the most talked-about attraction online. Ocean Park Hong Kong ranked second with 51,200 mentions, making up 26.5% of the total. With its long history, large-scale rides, and entertaining performances, it caters to visitors of all ages. Its themed events and seasonal exhibitions also help maintain a high level of online discussion.
In addition, Ngong Ping 360 (3,242 mentions, 1.7%) and Sky100 (708 mentions, 0.4%) stood out as unique experiential attractions that captured the attention of specific traveler groups. Ngong Ping 360 connects natural and cultural landscapes through its world-renowned cable car ride, while Sky100 offers a unique aerial perspective of the city, making it a top choice for those eager to discover Hong Kong from new heights. Madame Tussauds Hong Kong (1,204 mentions, 0.6%) also draws attention with its diverse lineup of celebrity wax figures, making it a popular indoor attraction for visitors who enjoy taking photos and sharing their experiences online.

● Insights into Online Buzz Sources
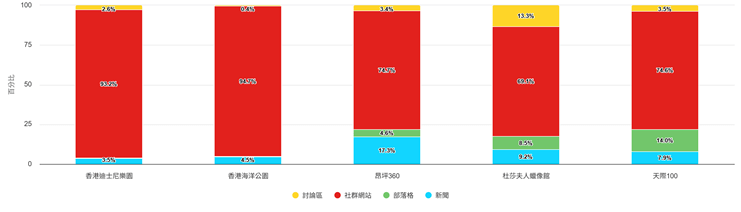
- Social media:Among all sources, social media accounted for the highest proportion, with all five attractions receiving over 69% of their mentions from these platforms. Notably, Hong Kong Ocean Park and Hong Kong Disneyland had the most concentrated discussions on social media, each exceeding 93%. One key topic was Disneyland’s “Buy-One-Get-One-Free” ticket promotion, which sparked widespread discussion, including giveaways and various promotional campaigns. YouTuber travel videos also contributed significantly to the buzz, such as Jian Xi Wang Mei Xiao Wu’s video “Hong Kong Flash Trip! Must-Visit Ocean Park”, which gained over 500,000 views and more than 9,500 comments.
- News media:Among the five attractions, Ngong Ping 360 had the highest proportion of mentions from news sources (17.3%), followed by Madame Tussauds Hong Kong (9.2%) and Sky100 (7.9%). This indicates that certain attractions still rely heavily on media coverage for exposure. News topics such as the launch of new features, seasonal events, or special occurrences can effectively drive short-term spikes in online buzz.
- Blogs:Mentions from blog sources were more prominent for Sky100 (14.0%) and Madame Tussauds (8.5%), mostly due to travelers sharing personal stories and in-depth travel experiences.
- Forums:Mentions from forums were generally low, with only Madame Tussauds (13.3%) and Ngong Ping 360 (3.4%) showing slightly higher proportions. These discussions mainly involved personal experiences and travel inquiries.
● Sentiment Analysis

- Hong Kong Disneyland recorded the highest total number of positive mentions (26,342) in this analysis, reflecting its strong market appeal and attention. However, with a large influx of visitors, it also attracted a considerable amount of feedback. The positive-to-negative sentiment ratio was 3.5, indicating that visitors have high expectations for their Disneyland experience.
- Ocean Park Hong Kong accumulated 15,045 positive mentions, with a positive-to-negative sentiment ratio of 6.47, showing a consistently high level of satisfaction overall. As a long-established, comprehensive theme park, it has managed to maintain a favorable sentiment ratio despite high visitor volume, suggesting widespread approval of its facilities and service quality.
- Ngong Ping 360 demonstrated an exceptionally high visitor satisfaction level, with a positive-to-negative sentiment ratio of 14.73. This figure highlights the park’s success in delivering an impressive travel experience that leaves a lasting positive impression on its visitors.
- Madame Tussauds Hong Kong had a positive-to-negative sentiment ratio of 4.81. As a well-known international attraction, it still retains a certain level of appeal among specific audience groups. Further enhancements in visitor experience could help strengthen its overall reputation.
- Sky100 performed the best in terms of sentiment, with a positive-to-negative ratio of 15.53 –the highest among all attractions analyzed. Although it had a smaller overall volume of mentions, the ratio indicates a highly satisfying experience and excellent overall reputation.
● Keyword Insight from Word Clouds –Top 5 Attractions in Hong Kong
★Hong Kong Disneyland –Word Cloud

Key trends:
1.Strong IP Appeal: Characters and themes like Disney Princesses, Pixar, and Marvel are the hottest discussion topics. Keywords such as “Mickey,” “princess,” “Frozen,” “Marvel,” and “fans” reflect the influence of these intellectual properties.
2.Seasonal Events and Highlights are Attractive: Visitors show strong interest in special events like stage shows, seasonal festivals, and parades. Related keywords include “parade,” “Halloween,” “performance,” “theme,” “festival,” and “spectacular.”
3.Appeals to Both Families and Independent Travelers: The park’s popularity is due in part to its ability to attract both family groups and young, independent travelers. Frequently mentioned terms like “family-friendly,” “kids,” “family,” “solo travel,” “couples,” and “friends” reflect a diverse audience.
★Ocean Park Hong Kong – Word Cloud

Key trends:
1.High Appeal of Signature Animals: Keywords like “panda,” “penguin,” and “animals” highlight the most attention-grabbing features, attracting both families and animal lovers.
2.Clear Family-Oriented Positioning: Terms like “children,” “parent-child,” and “family” confirm Ocean Park as a top choice for family tourism.
3.Pricing and Travel Planning are Key Concerns: High-frequency words such as “tickets,” “hotel,” “itinerary,” and “expenses” reflect that cost and travel arrangements are crucial decision-making factors for visitors.
★Ngong Ping 360 –Word Cloud

Key words:
1.Cable Car Experience is the Main Draw: “Cable car” is the most prominent term, alongside words like “crystal,” “cabin,” “scenery,” “beautiful view,” and “photos,” showing tourists’ interest in both the cabin types and the scenic ride.
2.Package Deals are Popular: Keywords like “combo tickets,” “Klook,” “independent travel,” “itinerary,” and “ticket prices” indicate that visitors prefer using platforms to plan and purchase value-packed tickets for a smooth travel experience.
3.Cultural and Surrounding Attractions are Valued: Terms like “Big Buddha,” “downtown,” “expo,” “restaurant,” “special exhibition,” and “culture” show that Ngong Ping 360 is a destination blending nature, culture, and relaxation.
★Madame Tussauds Hong Kong –Word Cloud

1.Strong Celebrity IP Attraction: Keywords such as “Madame Tussauds,” “wax figure,” “classic,” “celebrity,” “singer,” and “actor” highlight the appeal of celebrity figures as the museum’s core attraction, offering high visual and social media value.
2.Itinerary Linkage with Nearby Attractions: High-frequency keywords like “cable car,” “The Peak,” “Victoria Harbour,” and “night view” indicate that the wax museum is often included in classic Hong Kong itineraries, enhancing overall tourism appeal with scenic and dining combinations.
3.Balanced Appeal for Independent Travelers and Families: Keywords like “solo travel,” “family trip,” “filial piety,” “parents,” “combo ticket,” and “Klook” show that the museum attracts both family and individual travelers, who often plan visits in advance through online platforms.
★Sky100 –Word Cloud

1.Strong Connection with Travel Planning: Keywords such as “attractions,” “itinerary,” “combo ticket,” “cable car,” and “airport” appear frequently, showing that Sky100 is often mentioned alongside other attractions and transport hubs, making it a key part of integrated travel plans.
2.Focus on High-altitude Views and Dining Experiences: “Victoria Harbour” stands out in the word cloud, highlighting its status as the main scenic focus of Sky100. This is complemented by related keywords like “observation deck,” “high-rise,” and “night view.”
3.Relatively Low Brand Name Visibility: While “Sky100” appears in the word cloud, the font size is relatively small, indicating that users tend to use more general terms like “observation deck” instead of the brand name when referring to the attraction.

1. New Travel Regulation in Thailand: Digital Entry Card (TDAC) Launching in May
The Thai Immigration Bureau has announced the full implementation of the Digital Arrival Card (TDAC) system starting May 1, 2025. This new measure aims to reduce airport immigration processing times and signals a major shift in Thailand’s international entry procedures. Upon arrival at a Thai airport, travelers will only need to present a QR code issued by the system along with a valid passport. Airport staff will quickly verify the traveler’s information, eliminating the need for the traditional, time-consuming entry process.
/ Expand full text /
The new system requires all foreign travelers to complete an online application within 72 hours prior to their flight’s arrival (based on Thailand local time). Travelers must submit personal details and a health declaration via the official website. The system currently supports English and Simplified Chinese. After submission, applicants will receive a confirmation email with a QR code.
2. Osaka Expo Sparks Japan Travel Boom; Kobe Opens International Routes to Support Tourism
The official opening of the Osaka Expo is expected to attract over 3.5 million international tourists, according to organizers. Additionally, the launch of international flights at Kobe Airport on the 18th is set to further boost travel to Japan. Industry observers report that hotels in Osaka are nearly fully booked, with room rates rising more than 70% compared to pre-pandemic levels. Travel agencies also noted that nearly 90% of Japan-bound tours from Taiwan related to the Expo in April have already sold out.
/ Expand full text /
“On opening day alone, the Osaka Expo welcomed 141,000 visitors,” said Sachiko Yoshimura, Director of Overseas Promotion for the 2025 Japan International Expo Association, in an interview with Taiwanese media. She added that over 28 million people are expected to attend during the full duration of the event, with approximately 3.5 million foreign visitors. According to estimates from Japan’s Ministry of Economy, Trade and Industry, including surrounding infrastructure development, tourism, and commercial growth, the Expo is expected to generate an economic impact of 2.9 trillion yen.
3. Number of Foreign Tourists Visiting the U.S. in March Plunges Nearly 12% –First Significant Drop Since the Pandemic
According to the latest statistics from the U.S. Department of Commerce’s International Trade Administration, the number of foreign tourists visiting the United States in March fell by nearly 12% compared to the same period last year. This is a sharp increase from February’s 2% decline and marks the first significant drop since the onset of the COVID-19 pandemic. Industry experts worry that if this downward trend continues, the U.S. tourism industry could lose billions of dollars this year.
/ Expand full text /
As reported by The Washington Post last Friday (18th), the International Trade Administration’s data shows that:
● Visitors from the Caribbean dropped by 26% year-over-year
● Central American visitors decreased by 24%
● Western European tourists declined by 17%.
Specifically, visitor numbers from:
● Colombia fell by 33%,
● Germany by 28%
● Spain by 25%.
4.Taiwan Becomes South Korea’s 3rd Largest Source of Tourists; Target Set at 1.6 Million Visitors This Year
Yu Jin-ho, Director of the Tourism Content Division at the Korea Tourism Organization, stated today that Taiwanese tourists are South Korea’s third-largest source of international visitors. The goal for this year is to attract 1.6 million visitors from Taiwan, with key promotions focusing on marine tourism, pet-friendly travel, and wedding photography trips.
/ Expand full text /
According to data from Taiwan’s Tourism Administration under the Ministry of Transportation and Communications, Taiwanese outbound travel reached 16,849,683 trips last year, with 1,429,398 of those visiting South Korea. Taiwan ranks as South Korea’s third-largest tourist source, and the number of Taiwanese travelers to Korea in 2023 set a new historical record. This year’s goal is to further increase that number to 1.6 million, and figures from January to February already show a 34% increase compared to the same period last year.
5. 420,000 Taiwanese Traveled to Malaysia –Cultural Diversity, Language Affinity, and Affordability Drive Appeal
According to Taiwan’s Tourism Administration, a total of 423,117 Taiwanese travelers visited Malaysia in 2024, with the majority being seniors aged 60 and above. The Malaysia Tourism Promotion Board highlighted that Malaysia’s strengths lie in its cultural diversity, shared language familiarity, and affordable prices, making it more attractive compared to other Southeast Asian destinations.
/ Expand full text /
Globally, over 37 million visitors traveled to Malaysia in 2024. Among them, Taiwanese travelers accounted for more than 420,000. For 2025, Malaysia has set a target of 45 million total visitors, with a specific goal of attracting 500,000 tourists from Taiwan.
※CheeseAd is an advertising agency specializing in serving clients in the tourism industry. To better understand the current state of tourism in Taiwan for our foreign clients, we have selected news or information from your platform. If you have any comments regarding the above excerpts, please feel free to contact us. Thank you!

Key Summary
- There are approximately 6.6 million podcast listeners in Taiwan, primarily consisting of young and middle-aged adults, with a higher proportion of female listeners. The main listening demographic is aged 35–44, followed by those aged 28–34. Listeners are mainly concentrated in northern Taiwan and urban areas.
- Due to podcasts’ nature as a high-attention medium, brand messages are received in a distraction-free environment, making them more likely to influence purchasing decisions compared to other advertising formats.
- Dynamic Ad Insertion (DAI) is the preferred ad format among brand advertisers.
- The application of AI in podcasting continues to grow, bringing innovative tools and production methods.
- The rise of video podcasts is accelerating rapidly, becoming a key tool for attracting younger generations.
● Podcast Audio Economy Report Revealed –Grasping Future Trends
★ What is Podcast?
Podcasting originated in the early 2000s, emerging alongside the popularity of portable music players like the iPod. The term “Podcast” is a combination of “iPod” and “Broadcast.”
While podcasts have been popular in Western countries for many years, Taiwan saw a surge in listenership starting in 2019, following the outbreak of the pandemic. The year 2020 is considered “Year One” of Podcasting in Taiwan, during which not only podcasters, influencers, and celebrities joined the trend, but also traditional media outlets entered the podcasting space.
With the rapid development of digital media, podcasts have become a major source of information and entertainment for the public. Compared to traditional radio, podcasts are more convenient to listen to and offer more diverse content. Currently, SoundOn and Firstory are Taiwan’s two largest local podcast hosting platforms.
★ Podcast Audience Analysis
According to recent data reports published by SoundOn and Firstory, there are approximately 6.6 million podcast listeners in Taiwan, primarily made up of young and middle-aged adults, with a higher proportion of female listeners. The core listening group is aged 35–44, followed by the 28–34 age group. Geographically, northern Taiwan accounts for the largest share of listeners, with most of the audience concentrated in metropolitan areas.
Among high-income groups (annual income above NT$1 million) and middle-income groups (NT$600,000 to NT$1 million), there is a strong preference for high-value content, and these listeners are willing to spend time learning. Knowledge-driven content is the most captivating for this audience. The most popular podcast categories are:
◎Business ◎Society & culture ◎News ◎Education

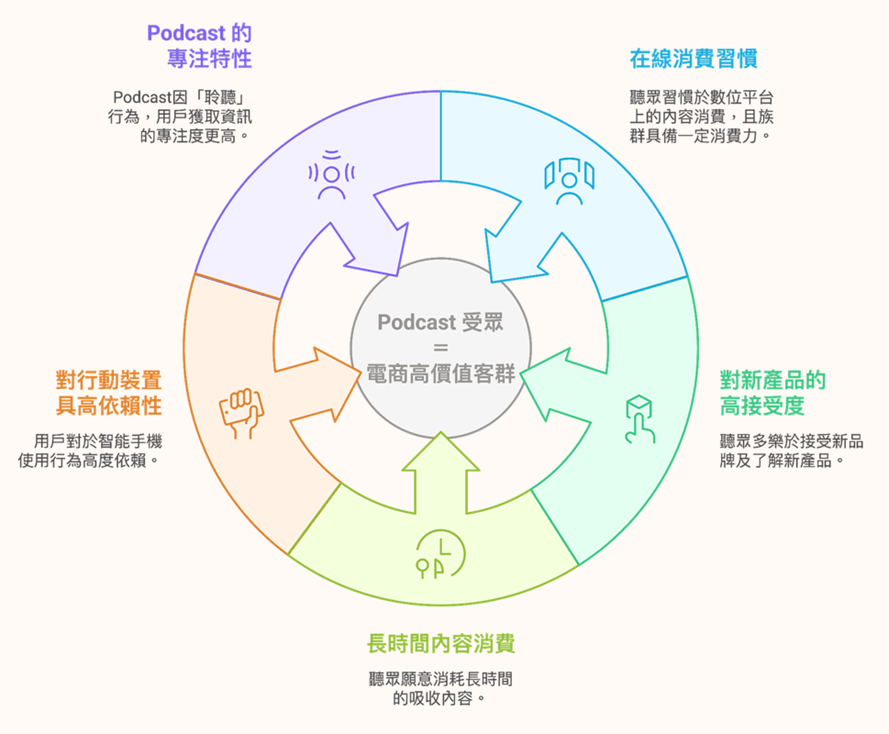
According to Magellan AI (a podcast advertising data analytics company), Amazon is currently the top spender on podcast advertising, indicating a high level of confidence in the overlap between podcast audiences and e-commerce consumers. Podcast listeners are willing to absorb information through long-form content, a behavior highly aligned with search, comparison, and decision-making patterns typical in e-commerce. This overlap suggests that podcast listeners are a high-consumption group.
In addition, podcasts’ high attention and low-interruption media environment allows brand messages to be fully received without distraction, making podcast ads more effective at influencing purchasing decisions than other forms of advertising.
■Image Source: SoundOn 2024 Voice Economy Report
■News Source: SoundOn 2024 Voice Economy Report, Firstory 2025 Trend Report
https://firstory.me/zh/2025-annual-report/
★Dynamic Ad Insertion (DAI)
Compared to host-read ads, interviews, or brand collaborations, DAI (Dynamic Ad Insertion) is currently the preferred ad format among brand clients. Its advantages include:
※Flexibility: Ads can be inserted across all authorized programs, increasing visibility and audience engagement.
※Efficiency: Automated processes save the time and resources typically required for manual ad insertion.
※Precise Targeting: Ads are targeted based on listener demographics and preferences.
※Analytics & Optimization: Multi-layered analysis reports help advertisers adjust and optimize ad performance based on detailed data.
■News Source: SoundOn 2024 Voice Economy Report, Firstory 2025 Trend Report
https://firstory.me/zh/2025-annual-report/
Four Key Podcast Trends for 2025
The definition of podcasts will undergo a major transformation in 2025, expanding across four main areas:
1.Advertising: Podcasts as an infinite business opportunity
Podcast advertising will further unlock its commercial potential in 2025, offering three key advantages over other ad formats:
● Wider reach
● Higher income audiences
● Greater listener focus
Podcast ads cover the full consumer journey –from discovery to consideration to purchase. Brands reallocating just 1–2% of their ad budget to podcasts could see up to a 26% increase in ROI.
2.Subscriptions: Podcasts as membership clubs
Firstory is Taiwan’s only podcast platform offering a subscription model and continues to innovate with services that are increasingly diverse and user-friendly, such as Google login integration, support for Apple and Spotify, and Email scheduling features. Market data shows rising podcast subscription revenue, making it a reliable source of income for creators.
3.AI: Podcasts as a product of intelligence
AI applications in podcasting are deepening, bringing innovative tools and production methods such as:
※Text-to-Podcast: Google NotebookLM enables voice summaries and content conversion into podcast format.
※Podcast-to-Text: Firstory will launch a “Content Extraction” feature in 2025 to convert podcast episodes into summaries, mind maps, and Q&A.
※Podcast-to-Podcast: Firstory partners with TheKeeper to offer creators AI-powered voice generation and translation services across Chinese, English, Japanese, and Korean.

4.Video: Podcasts as a multimedia experience
The growth of video podcasts is rapidly rising, becoming a key tool to engage younger generations. According to Spotify, 57% of Gen Z viewers actively watch the video content, and video podcast engagement is 30% higher. However, 69% of users still prefer audio-only content, proving that audio podcasts remain dominant.
In 2025, podcasts will evolve beyond media –they will become a core tool for brand communication, content creation, and community building. Multimedia integration and AI innovation will enhance the overall podcast value, while ad and subscription models open up endless opportunities for creators.
■News Source: Firstory 2025 Trend Report
https://firstory.me/zh/2025-annual-report/

Creative concept:
Golden Exhibition Travel has been honored with the prestigious Gold Award four times for its Turkey tours. Now, with the same dedication, it presents a breathtaking new chapter –Spain. To help consumers truly feel the care and richness of the Turkey and Spain itineraries, we are launching the campaign: “Travel with Golden Exhibition –Encounter Beauty Through Words.” Three renowned writers from different fields have been invited to collaborate across disciplines, using prose and photography to guide consumers on a journey of pure emotion and discovery.
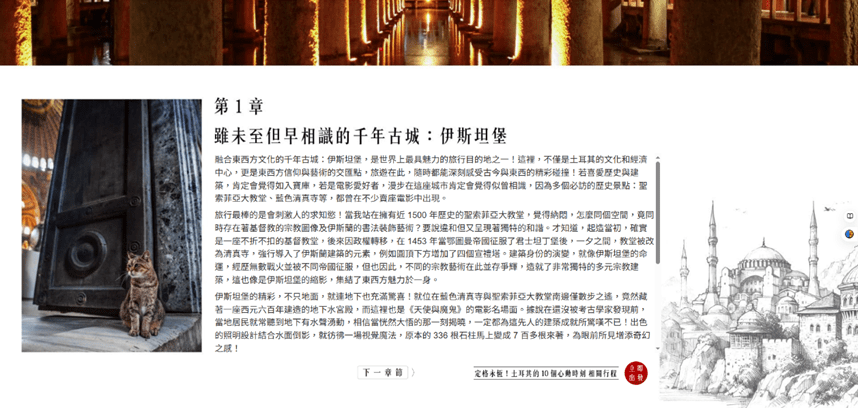
Industry First: Turning Itineraries into Short Stories –Every Day of Travel is the Beginning of a Story
★ An industry first! Turkey and Spain itineraries are transformed into short stories by celebrated authors, immersing travelers in heartfelt words and captivating images –the start of a dream journey.
★ Freeze the moment forever! “10 Heart-Stirring Moments in Turkey” –by aesthetic photographer and travel columnist Chen Yao-En
★ “10 Untold Memories of Classic Turkey” –by Layla, a renowned author living in Turkey
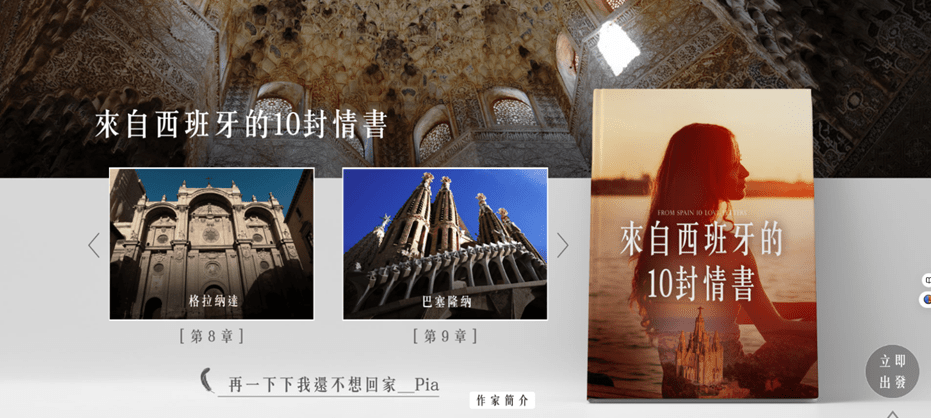
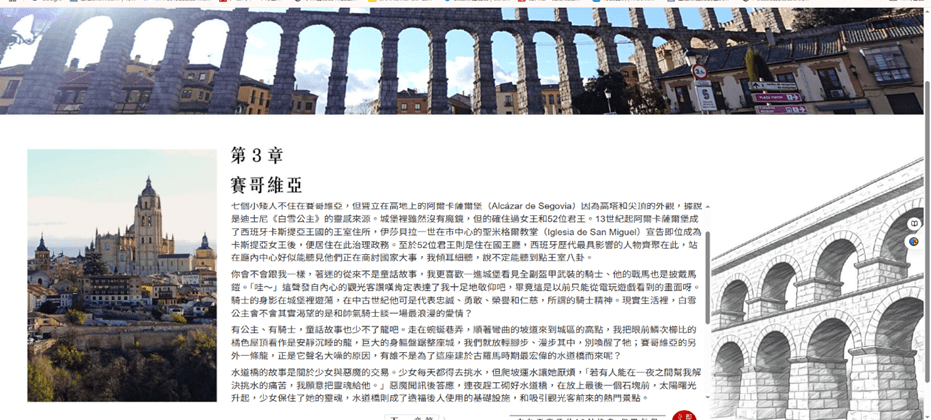
★ “10 Love Letters from Spain” –by well-known TV producer Pia
Brand website:https://goldtravel.com.tw/book/

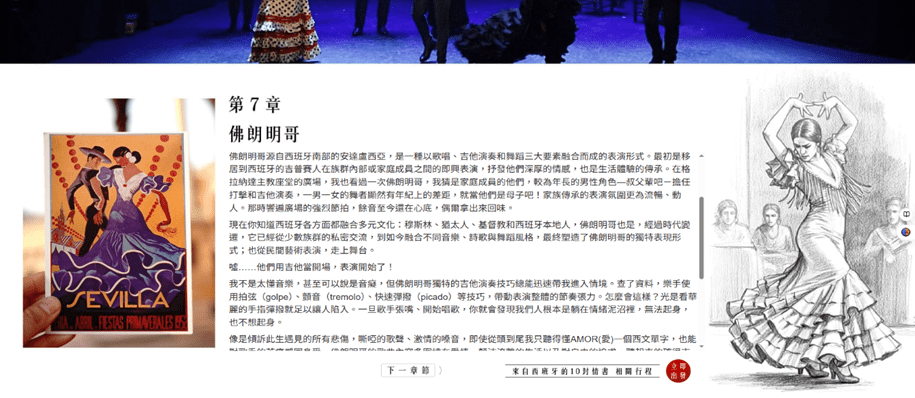
Page Presentation of “10 Heart-Stirring Moments in Turkey”

Users can click on each chapter, with the content page showcasing the Turkey itinerary beneath as a guided booking entry point.

Users can click on each chapter, with the content page showcasing the Turkey itinerary beneath as a guided booking entry point.

Users can click on each chapter, with the content page showcasing the Turkey itinerary beneath as a guided booking entry point.

Users can click on each chapter, with the content page showcasing the Turkey itinerary beneath as a guided booking entry point.

Users can click on each chapter, with the content page showcasing the Turkey itinerary beneath as a guided booking entry point.
Users can click on each chapter, with the content page showcasing the Turkey itinerary beneath as a guided booking entry point.