
● Key Economic Indicators of Taiwan (Data released before Sept. 1st, 2025)
 GDP Economic Growth Rate (yoy) 2.81 (%) 2026 forecast |
 CPI Change Rate 1.54 (yoy, %) Jul. 2025 |
 Unemployment Rate 3.40 (%) Jul. 2025 |
 Monthly Regular Earnings of All Employees (Industry and Services) 47,798 (NT dollars) Jun. 2025 |
- In July 2025, the Consumer Price Index (CPI) rose by 0.37% compared with the previous month (June). After adjusting for seasonal factors, it increased by 0.24%. Compared with the same month in 2024, it rose by 1.54%. On average, from January to July, the CPI increased by 1.87% year-on-year. The Producer Price Index (PPI) in July fell by 0.54% from the previous month and declined by 6.44% compared with the same month in 2024. On average, from January to July, the PPI dropped by 0.69% year-on-year.
- In July 2025, the number of employed persons was 11.638 million, an increase of 21,000 people (0.18%) compared with June. The number of unemployed was 409,000, up by 5,000 people (1.39%) from the previous month. The number of people not in the labor force was 8.195 million, a decrease of 29,000 people (0.35%) compared with June. The labor force participation rate in July was 59.51%, up by 0.13 percentage points from the previous month.
- In June 2025, the average regular earnings of all employees (including full-time and part-time workers, both domestic and foreign) was NT$47,798, down 0.01% from the previous month but up 2.84% year-on-year. Average non-regular earnings (such as bonuses and overtime pay) amounted to NT$8,713, bringing the total average monthly earnings to NT$56,511, down 8.85% from the previous month but up 1.88% year-on-year. The median of regular earnings was NT$38,218, a decrease of 0.02% from the previous month but an increase of 2.45% year-on-year.
Source: National Statistics, Republic of China (Taiwan)
● Statistics on Republic of China Nationals Traveling Abroad
| Outbound departures of nations in January – June 2025 9,141,262 |
| Year on Year +10.6% |
| Outbound departures of nations in May 2025 1,648,672 |
| Month on Month +8.1% |
Number of Trips and Growth Rate of Republic of China Nationals Traveling Abroad in June 2025 and from January to June 2025 –By Destination

★Source: Ministry of the Interior, Immigration Office (Republic of China)
Note: The outbound travel data for Republic of China nationals is based on the principle of counting the first destination reached by flight. Additionally, factors such as irregular chartered flight itineraries are included. Therefore, for the actual data on Taiwanese nationals traveling to specific countries, please refer to the official inbound statistics published by each destination country.
● Passenger Numbers of Cruise Ships at International Commercial Ports in the Taiwan Region
| Outbound departures of nations in January – June 2025 544,121 |
| Year on Year +136.9% |
| Outbound departures of nations in June 2025 116,367 |
| Month on Month +138.8% |

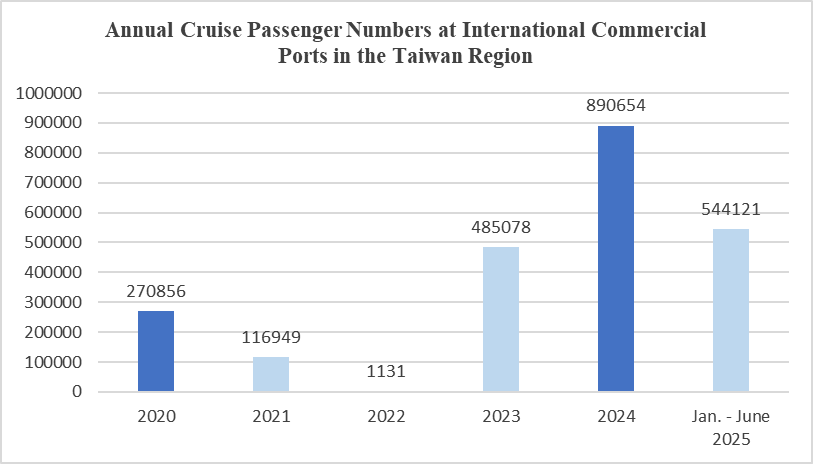
Source: Taiwan International Ports Corporation, compiled based on passenger entry and exit numbers reported by each port branch company
International Cruise Companies and Cruise Ships Stationed in Taiwan in 2025
| Affiliated Cruise Companies | Cruise Ships Operating in Taiwan | Tonnage | Passenger Capacity | Home Port in Taiwan |
| Costa Cruises | Costa Serena | 114,500 | 3,780 | Keelung Port/ Kaohsiung Port |
| MSC Cruises | MSC Bellissima | 172,000 | 5,686 | Keelung Port |
| Norwegian Cruise Line | Norwegian Spirit | 75,338 | 2,018 | Keelung Port |
| Star Cruises | Star Navigator | 75,338 | 1,856 | Keelung Port |

Latest Voyage Statistics of International Cruise Companies in Taiwan from 2023 to 2025

Solo Travel on the Rise! Online Buzz Analysis
● Overview
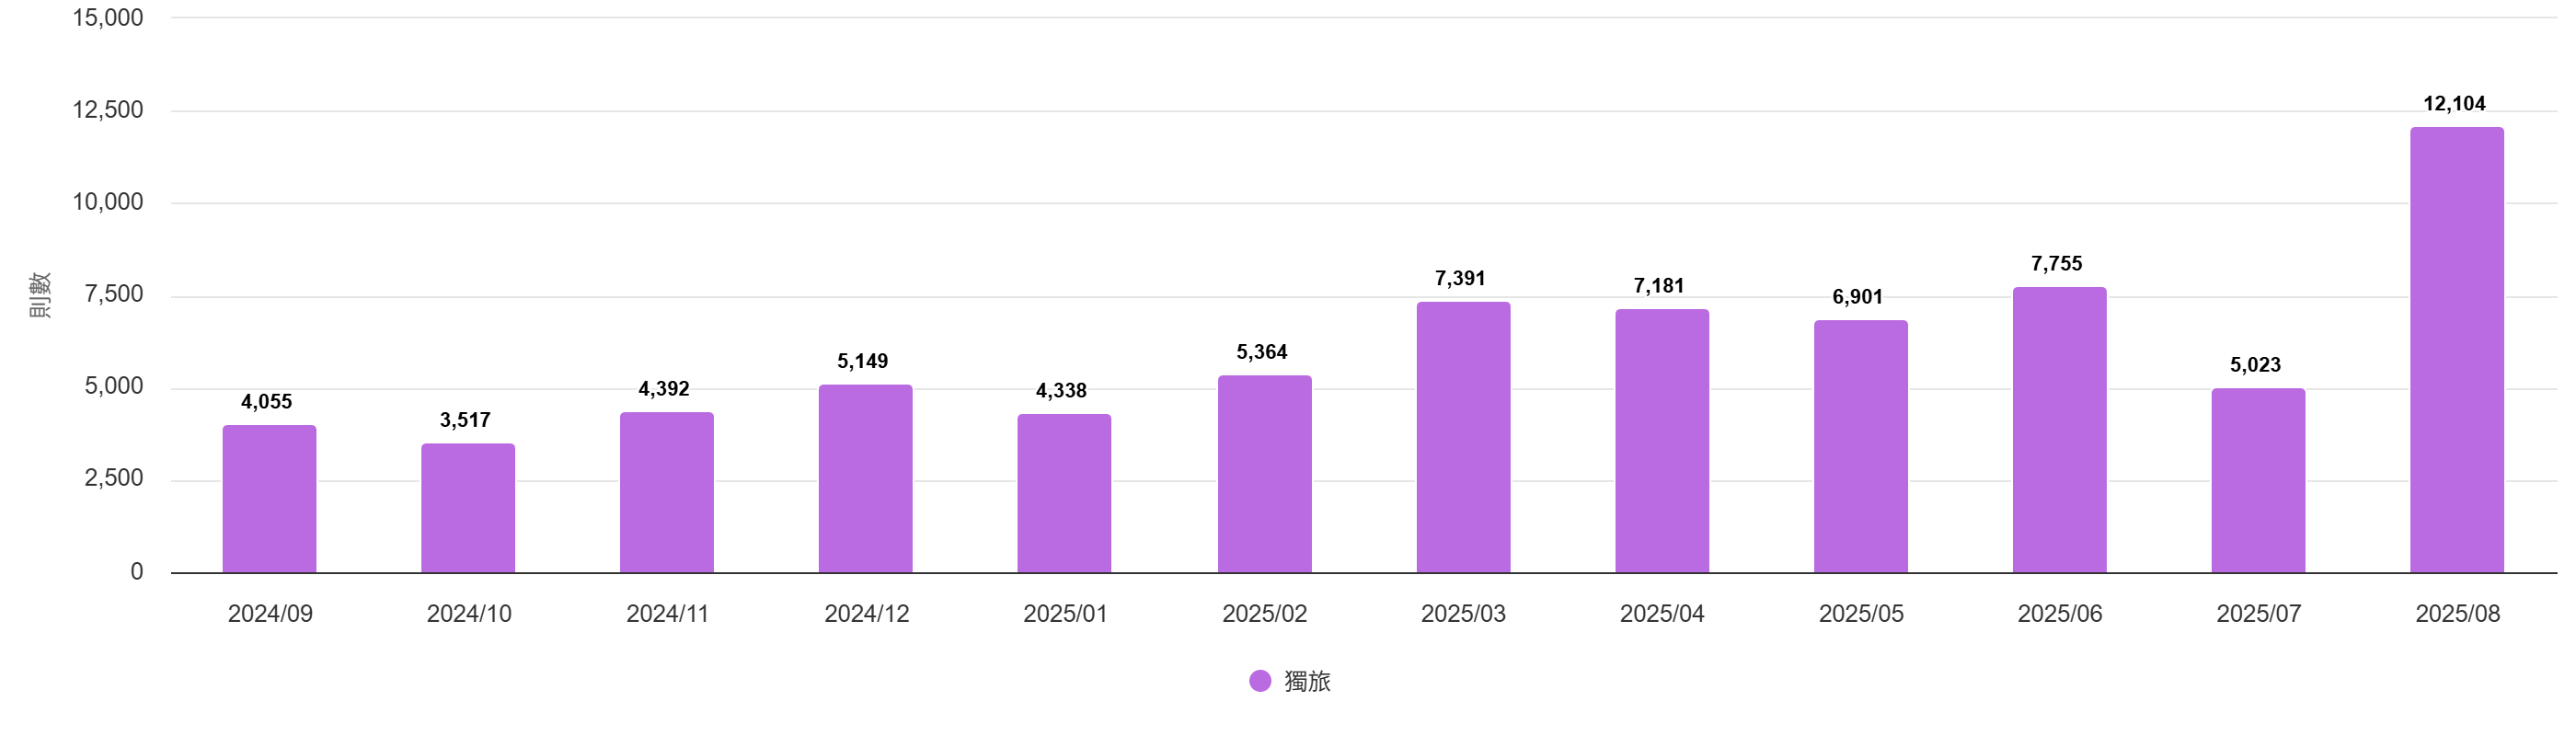
Observation Period: Sept. 01, 2024 – Aug. 31, 2025
Sources: Discussion forums, social media, news, blogs
Note: This online insight analysis is based on data from the OpView Social Media Database and reflects the number of online discussions related to the “solo travel.”
Over the past year, online discussions related to solo travel have shown a steady upward trend, indicating growing public interest in traveling alone. Solo travel is becoming a hot topic and has even developed into a notable travel trend. What was once a niche interest has gradually turned into a mainstream travel style.
According to data from the OpView Social Listening Database, online mentions have been climbing since February 2025, with volume consistently surpassing 7,000 mentions between March and June 2025. This surge was likely driven by the spring break, long weekends, and peak travel season. In particular, topics such as female solo travel and short-haul solo trips to Japan and South Korea generated significant discussion. In August 2025, online buzz skyrocketed to 12,104 mentions, setting a new yearly high. This sharp increase may have been fueled by the summer holiday peak season, widespread sharing of solo travel experiences on social media and news outlets, as well as travel fairs, airline promotions, and activities launched by travel platforms, all of which stimulated related discussions.
● Insights on Sources of Online Mentions
A、Source Distribution Analysis

Observation of online discussions on solo travel from September 2024 to August 2025:
1.Social Media as the Main Driver
Social media platforms accounted for nearly 70–80% of total volume, showing that the “solo travel” topic relies heavily on social media for diffusion.
Notably, in March 2025 and August 2025, social media mentions spiked sharply (reaching 6,080 and 11,089, respectively), pushing overall discussion volume to record highs.
2.Discussion Forums and Blogs as Secondary Sources
Online forums maintained a stable range of around 600–1,000 mentions, mainly serving as platforms for information exchange and travel tips sharing.
Blogs generated the lowest volume, only 50–115 mentions, focusing on in-depth travelogues but with relatively limited influence.
3.News Media: Low Volume but Event-Driven
News coverage was relatively low (about 150–965 mentions), but often emerged in connection with travel-related events, public safety news, or policy issues.
B、Platform Ranking Insights

1.Threads: Overwhelming Leader
With nearly 25,000 mentions, Threads ranked first, far surpassing other platforms. This shows that the topic of solo travel has exploded among younger users and within real-time social communities.
Thanks to its rapid diffusion characteristics, Threads has become the core arena driving the surge in solo travel discussions.
2.Facebook and YouTube: Diverse Ecosystems
Facebook fan pages, public groups, and private groups together ranked second in volume, forming internal discussion chains within the community.
YouTube videos and comment sections also served as major sources of discussion, underscoring that video-based travel sharing remains mainstream.
3.Local Taiwanese Forums Still Influential
Platforms like Dcard and PTT continued to play a stable role in exchanging practical solo travel experiences and sharing travel tips. Although their overall volume did not match the explosive growth on Threads, their depth of influence remains significant.
● Gender Ratio and Interest Tags

A、Gender Distribution
According to the data, discussions related to solo travel were made up of approximately 55% female and 45% male participants, showing a fairly balanced ratio.
Both men and women actively engaged in the topic, indicating that solo travel is not exclusive to a particular gender but is instead a travel style widely embraced across diverse groups.
B、Thematic Channel Characteristics
Based on interest tags, discussions around solo travel covered a wide range of themes, demonstrating strong connections with daily life, cultural entertainment, and consumer choices. The main features can be summarized as follows:
1.Core Travel Topics
Tags such as travel accommodation, food, cooking, and lifestyle sharing appeared frequently, showing that the focus of solo travel discussions remains on accommodation choices, culinary exploration, and everyday experiences. Female participants, in particular, showed a preference for combining travel with lifestyle elements –for example, food photography, cooking experiences, or staying at unique accommodations.
2.Information and Content Creation
The appearance of tags such as news and video creation suggests that solo travel is not only about personal experiences but also serves as a source of content for social media sharing and media reproduction. Some travelers turn their solo travel records into videos or articles, further amplifying discussions within online communities.
3.Transportation and Mobility
The transportation tag reflects solo travelers’ strong demand for safety, convenience, and efficiency in planning. This is especially relevant for nearby domestic trips or overseas free travel.
● Solo Travel Keyword Insights –Word Cloud
★ Solo Travel Word Cloud

A、Core Keywords
In the word cloud, “solo travel” and “alone” stand out as the most prominent core terms, highlighting how users strongly associate the concept with independence and individual action. This is not only a form of travel but also a symbol of modern people’s pursuit of self-fulfillment and inner freedom.
B、Main Areas of Focus
1. Itinerary and Destination Planning
Frequent mentions of words like itinerary, sights, routes, and guides suggest that solo travelers place strong emphasis on detailed trip planning.
Place names such as Tokyo, Osaka, Kyoto, Busan, Fukuoka, Okinawa, and Thailand reflect popular destinations favored by solo travelers.
2. Transportation and Ticketing Needs
Keywords like air tickets, airport, train, and airplane reveal travelers’ high concern with transportation methods and booking arrangements.
Terms like free travel and journey indicate that most solo travelers prefer flexible, self-guided trips rather than group tours.
3.Food and Lifestyle Experiences
Words such as food, coffee, and restaurant show that sampling local cuisine is an important part of solo travel. Beyond being part of the journey, it also carries lifestyle-sharing value.
4. Recording and Social Sharing
Terms like video, photo, mobile phone, and feelings suggest that solo travelers enjoy documenting their trips through images and often share them on social media. The appearance of netizens further reflects how online interaction and experience exchange are key drivers of solo travel discussions.

1. U.S. Visa to Include Additional $250 Security Deposit Effective Oct. 1 –Tourism Industry Concerns
The Trump administration has announced a new rule for tourist visas, requiring foreign travelers applying for entry visas to also pay a so-called “Visa Integrity Fee” of $250. This measure raises the total cost of a U.S. tourist visa to $442, the highest in the world, and may discourage travelers from non–visa waiver countries, posing a negative impact on U.S. tourism development.
Federal data shows that in July, the number of visitors to the U.S. dropped 3.1% year-on-year to just 19.2 million, marking the fifth consecutive month of decline this year. This trend puts the goal of surpassing the pre-pandemic level of 79.4 million annual visitors by 2025 far out of reach.
2. Boosting Tourism! Thailand Plans to Offer 200,000 Free Domestic Flights to Foreign Travelers
According to the Philippines bureau of the UK’s Daily Mail, the Thai government is preparing to launch a new initiative to revitalize its tourism sector by giving away 200,000 free airline tickets to foreign visitors. The measure aims to counter the decline in tourist arrivals and to stimulate local tourism ahead of the peak season.
To reverse the downward trend, Thailand will introduce a campaign called “Buy an International Ticket, Get a Free Domestic Flight.” From September to December, 200,000 free domestic flight tickets will be offered to international travelers. The program is designed to disperse visitors beyond major hubs such as Bangkok, Phuket, and Chiang Mai, encouraging exploration of less-traveled destinations.
3. Q4 Japan Tour Package Prices Expected to Drop 5–10% –Travel Quality Assurance Association: Korea Remains Popular
The Travel Quality Assurance Association yesterday (29th) released its Q4 recommended tour package prices. For popular destinations, package prices for Japan are projected to fall 5% to 10% compared with the same period in 2024, while prices for Korea are expected to remain stable. The association also reminded travelers to carefully review contracts and safety guarantees before signing up, to ensure a fun and worry-free trip.
Which country do Taiwanese travelers love the most? According to statistics from the Tourism Administration, from January to May 2025, outbound trips by Taiwanese reached 7.49 million, with Japan ranking first at 2.68 million visits –a record high. Meanwhile, Japan’s official data shows that its top three inbound visitor markets are Korea, China, and Taiwan. Taiwan remains in third place, but its growth has lagged behind the overall market, suggesting a cooling trend. The association predicts that in Q4 this year, Japan package tour prices for most regions will drop 5%–10% from last year, with peak prices already behind; by contrast, Korea’s popularity shows no sign of slowing.
4. Record-Breaking Heat in Japan! Autumn Foliage and Cherry Blossoms May Be Delayed, Impacting Tourism
The Japan Meteorological Agency forecasts that temperatures will remain above average over the next three months (September to November). This prolonged heatwave may have an impact on Japan’s tourism industry. Experts caution that for travelers planning to view autumn foliage, this year’s season could be delayed –in some areas by as much as two weeks.
For Japan’s tourism sector, such climate changes pose new challenges. Industry players may need to reconsider traditional travel seasons and develop new tourism offerings to adapt to the effects of shifting weather patterns.
5. EVA Air Partners with Southwest Airlines to Expand U.S. Domestic Network
EVA Air announced today (26th) that it has officially launched a partnership with Southwest Airlines. Through EVA’s flights to Los Angeles, San Francisco, Seattle, and Chicago, travelers can now connect seamlessly to Southwest’s extensive U.S. network, covering more than 30 cities including Phoenix, Austin, Las Vegas, and Denver. This cooperation strengthens EVA Air’s presence in the U.S. domestic market.
Southwest Airlines is the largest carrier in the U.S. by passenger volume, with a fleet of over 800 aircraft. Under this partnership, passengers can book connecting itineraries –combining EVA Air’s four U.S. gateways with Southwest’s domestic routes –directly via EVA Air’s official website or major travel agencies. The joint service offers convenient benefits such as through check-in, baggage check-through, and smooth flight transfers.
※CheeseAd is an advertising agency specializing in serving clients in the tourism industry. To better understand the current state of tourism in Taiwan for our foreign clients, we have selected news or information from your platform. If you have any comments regarding the above excerpts, please feel free to contact us. Thank you!

Key summary
- According to Chen Po-Chuan, convener of the DMA Research Group in charge of this advertising volume survey and head of performance marketing at Ampower, since 2024 there has been a clear impact of AI on the overall digital advertising ecosystem –in areas such as traffic, ad placements, and content generation –and this influence is set to grow even stronger this year.
- With the rise of conversational AI tools such as ChatGPT and Claude, consumers can now receive integrated answers directly from AI. This challenges the traditional model where websites relied on SEO optimization to compete for search rankings and thereby generate traffic and ad revenue.
- An increasing number of platforms are incorporating AI for automated allocation –from ad creatives and placements to large-scale customized ad generation –reshaping traditional strategies for budget distribution.
- As consumer behavior becomes increasingly diverse and established platforms encounter growth bottlenecks, emerging channels such as retail media and connected TV (CTV) are drawing attention. This trend also drives demand for first-party data exchanges, requiring the industry to establish frameworks for data sharing and identity recognition (ID) in order to achieve personalized ad targeting.
● Taiwan’s digital advertising market reaches NT$63.683 billion in 2024 –E-commerce industry remains the leader, surpassing the NT$10 billion mark
On August 6, the Digital Marketing Association of Taiwan (DMA) released the 2024 Annual Taiwan Digital Advertising Expenditure Report, showing that Taiwan’s digital advertising market reached NT$63.683 billion. However, due to global political and economic uncertainty in the first half of 2024, the domestic market underperformed. With Trump’s election stabilizing the situation, market momentum returned in the fourth quarter. As a result, Taiwan’s overall digital advertising market in 2024 recorded only a 4.32% growth.

In terms of industries, e-commerce remained the leader in digital advertising investment, reaching NT$10.367 billion, a year-on-year growth of 5.49%, and surpassing the NT$10 billion milestone for the first time, with a digitalization rate as high as 95%. The app/gaming industry ranked second with NT$7.245 billion, but due to China’s tightening of gaming industry regulations and the lack of blockbuster titles, it saw a 1.13% decline.
The strongest growth momentum came from the leisure & entertainment sector (11.88%) and the fashion & luxury sector (10.34%). Following the pandemic, global artists have resumed world tours, and with the official opening of the Taipei Dome, Taiwan’s concert and experiential entertainment economy has boomed, driving a strong rebound from a low base and resulting in double-digit growth for both industries.

The report indicated that mobile advertising spending reached NT$49.533 billion, accounting for 77.9% of total digital advertising, demonstrating that Taiwanese consumer behavior has become fully mobile and that mobile platforms are now the primary arena for purchase decisions. Analyzing by media type, traditional media advertising amounted to NT$39.604 billion, with a growth rate of 4.58%, while social media advertising reached NT$24.079 billion, growing 3.89%. The ratio between the two remained the same as in 2023, at approximately 1.6:1.
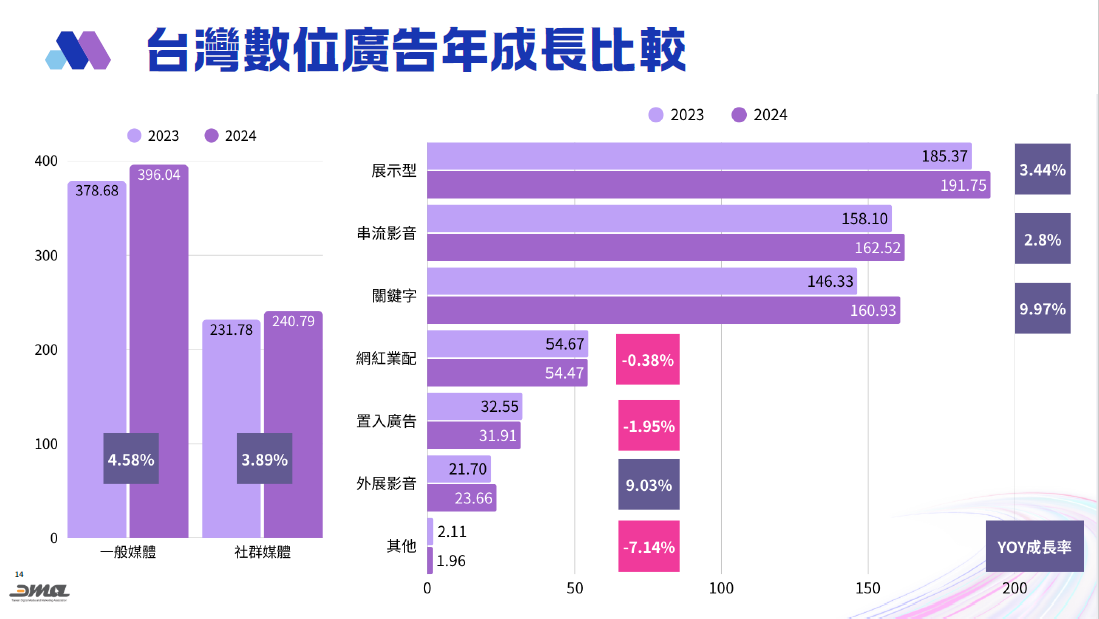
Among various types of advertising, search (keyword) advertising recorded the highest growth last year, with a 9.97% increase, benefiting from the recovery of the travel and entertainment industry, active investment by overseas e-commerce brands, and the impact of AI-driven automated ad placement.9.97%。

Comparing the overall media landscape over the past decade, changes in digital video and television advertising indicate that in 2024, digital video advertising reached NT$18.619 billion, while television advertising amounted to NT$17.160 billion. Digital video advertising grew 3.5%, whereas television advertising declined 3.7%, highlighting a clear shift in media consumption habits.
Source: Digital Media Association of Taiwan (DMA)
●Latest Taiwan Digital Advertising Expenditure Report –Download
250804-DMA2024台灣數位廣告量報告.pdf – Google 雲端硬碟

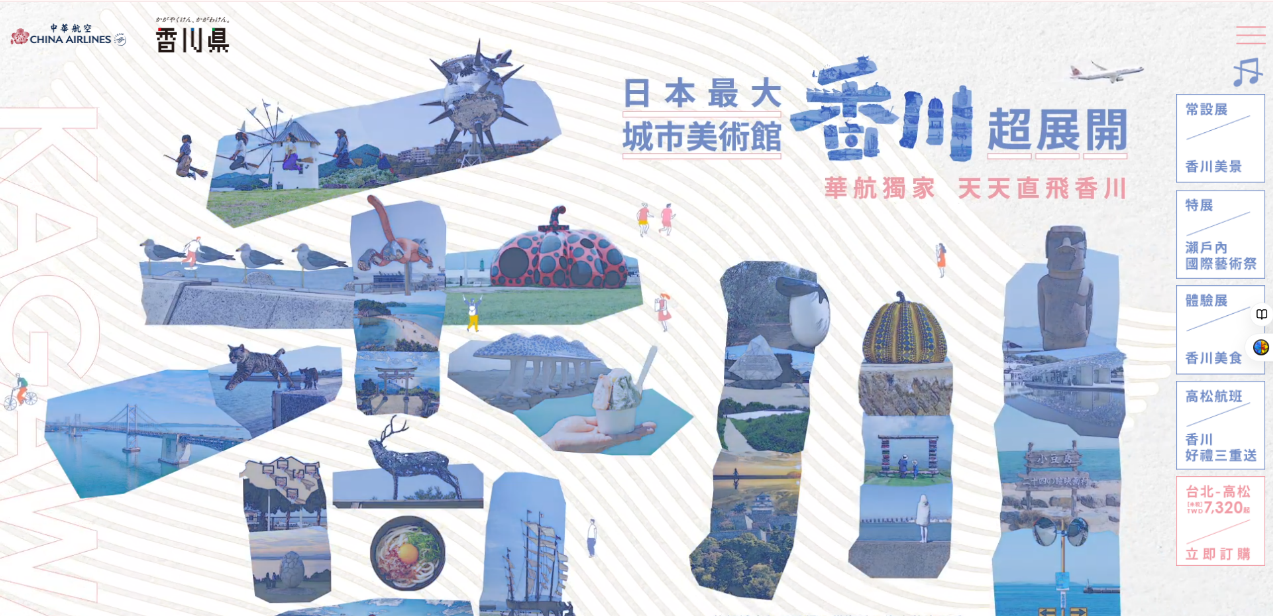
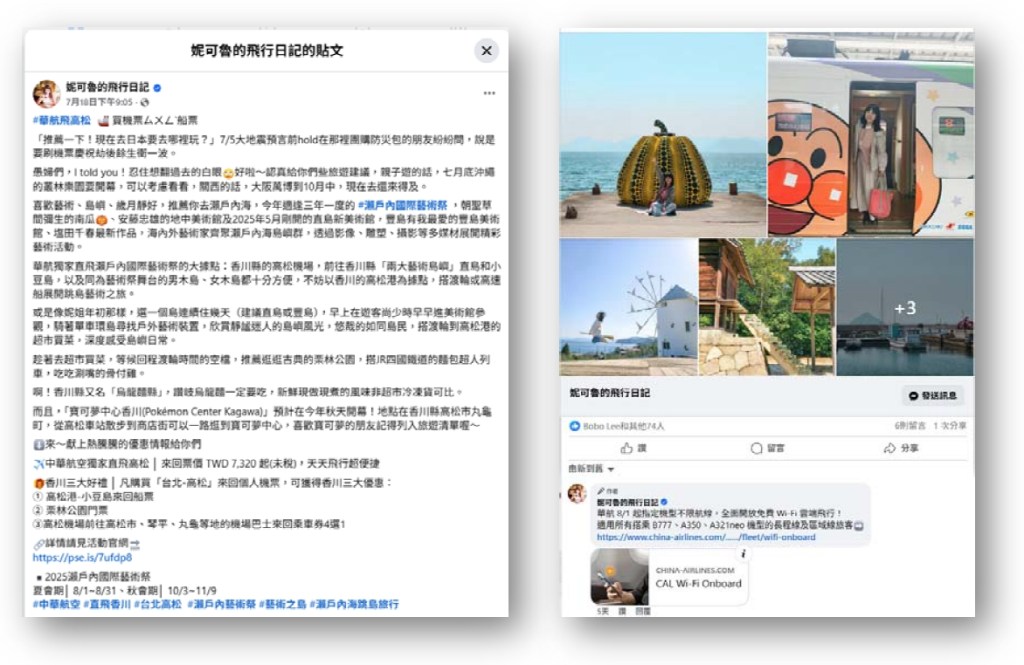
China Airlines flies daily to Kagawa (Takamatsu), 7 flights per week, in conjunction with the “2025 Setouchi International Art Festival” –this attracts travelers to visit Kagawa.
The “2025 Setouchi International Art Festival” is a large-scale art exhibition themed “Reclaiming the Sea”, combining contemporary art, local culture, and natural scenery. It will feature works by hundreds of artists and art groups from around the world.
The exhibits not only reflect the artists’ perspectives and ideas but also closely integrate with local traditional culture and the characteristics of the sea, showcasing the region’s diversity. It is an event that art and culture enthusiasts must experience. Featured participants include Taiwan’s Cloud Gate Dance Theatre, internationally active artist Shunlong Lin (France/Japan), and Wang Wenzhi, who will be participating in the Setouchi International Art Festival for the fifth time –highly anticipated.
Concept Idea:
Kagawa is at the heart of the Setouchi International Art Festival. In addition to permanent installations from previous years, the 2025 festival will showcase new works, turning the entire city into a museum, attracting travelers to purchase tickets to visit.
“Kagawa Unfolded –Japan’s Largest City Museum”
Event webpage concept:
Position Kagawa as Japan’s largest city museum, divided into:
-Permanent Exhibits: Kagawa’s scenic beauty
-Special Exhibits: 2025 Setouchi International Art Festival
-Experiential Exhibits: Kagawa’s cuisine
https://event-2.7to.com.tw/25ci_kagawa/
Japan’s Largest City Museum –Permanent Exhibit: Introduction to Kagawa’s Scenic Beauty
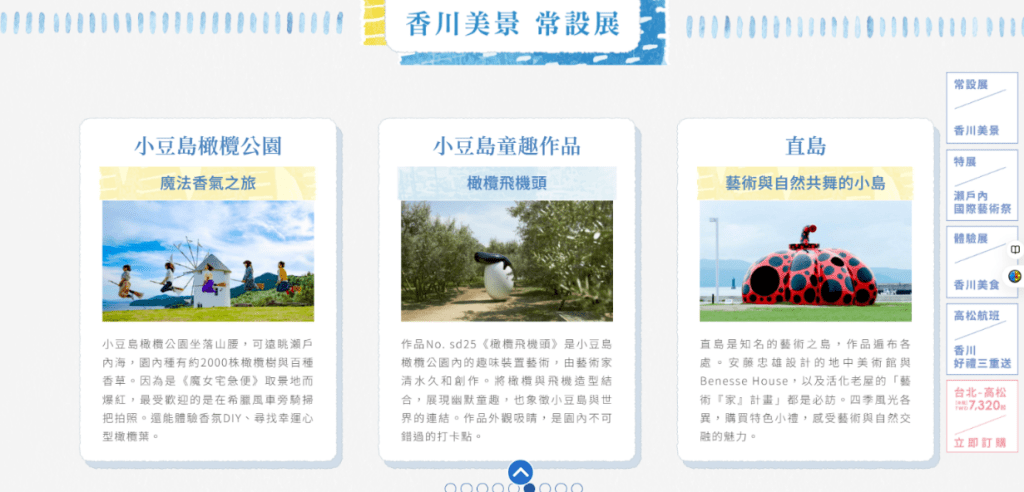
Japan’s Largest City Museum –Special Exhibit: Introduction to the 2025 Setouchi International Art Festival

Japan’s Largest City Museum –Experiential Exhibit: Introduction to Kagawa’s Cuisine

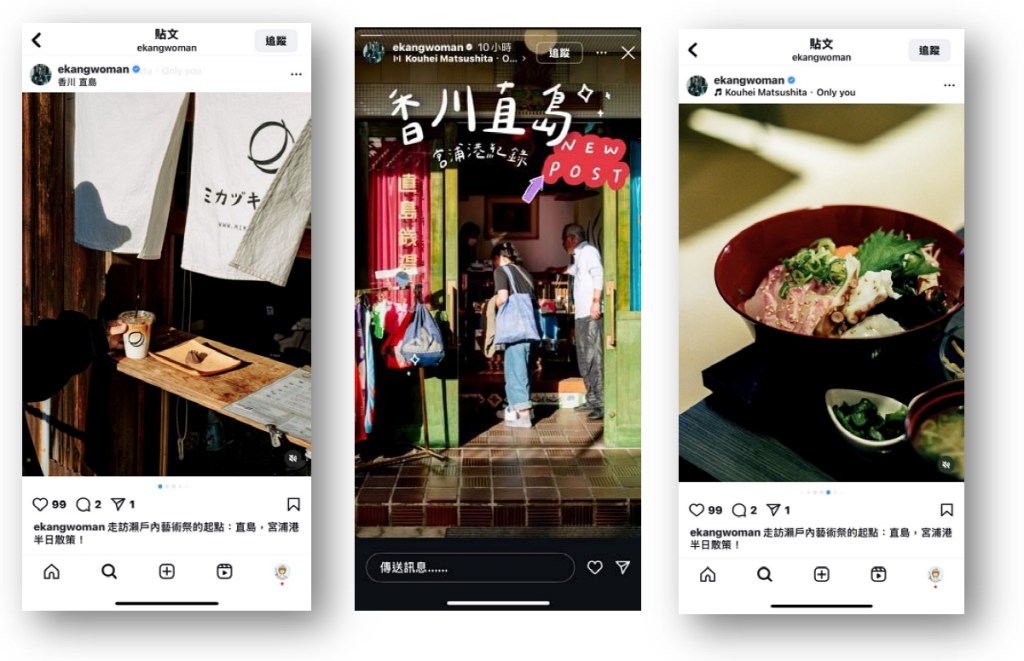
KOL Collaboration –Xiagang Girls
Facebook and Instagram posts sharing about Kagawa and the 2025 Setouchi International Art Festival
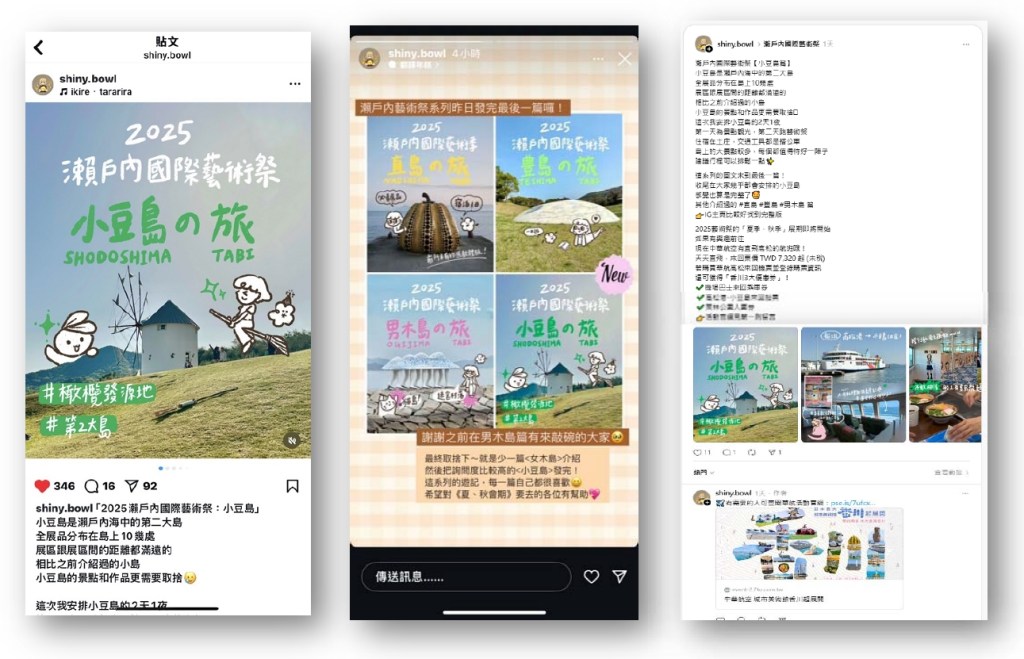
KOL Collaboration –Ryobi (リョウビ)
Instagram and Threads posts sharing about Kagawa and the 2025 Setouchi International Art Festival
KOL Collaboration –Skinny-Leg Guy
Facebook and Instagram posts sharing about Kagawa and the 2025 Setouchi International Art Festival
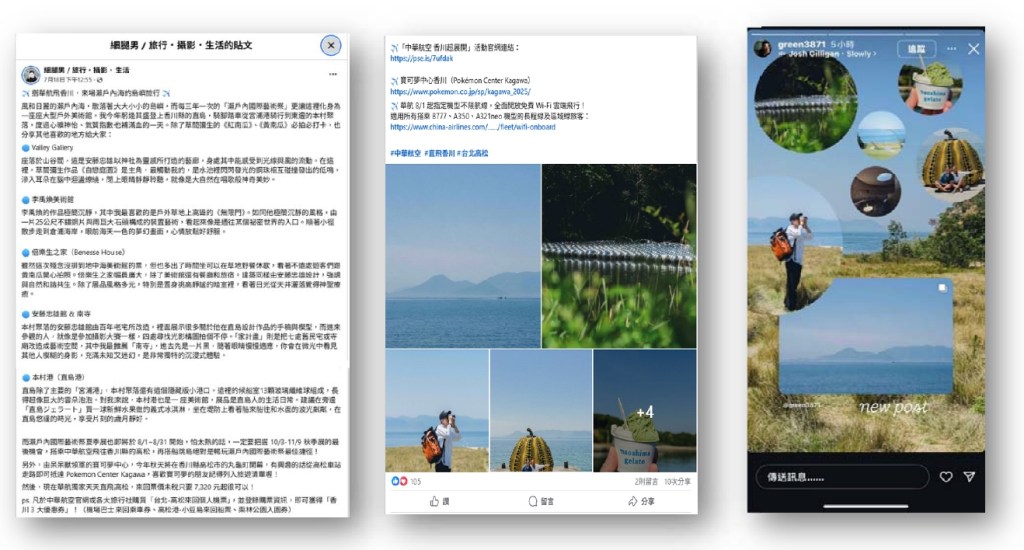
KOL Collaboration –Nicole’s Flight Diary
Facebook posts sharing about Kagawa and the 2025 Setouchi International Art Festival
KOL Collaboration –Miya’s Business Trip Mini Travels
Facebook posts sharing about Kagawa and the 2025 Setouchi International Art Festival

Taipei International Summer Travel Fair –Hanging Banner Advertisement Inside the Exhibition Hall

Taiwanese retro-style instant film cameras paired with the Kagawa City Museum concept
Custom Kagawa-themed instant cameras allow consumers to take photos while traveling in Kagawa.

