
● Key Economic Indicators of Taiwan (Data released before Oct. 31st, 2025)
 GDP Economic Growth Rate (yoy) 2.81 (%) 2026 forecast |
 CPI Change Rate (yoy) 1.48 (%) Oct. 2025 |
 Unemployment Rate 3.38 (%) Sep. 2025 |
 Monthly Regular Earnings of All Employees (Industry and Services) 48,110 (NT dollars) Sep. 2025 |
- In October 2025, the Consumer Price Index (CPI) decreased by 0.47% compared to September, but increased by 0.25% after seasonal adjustments. Compared to the same month in the previous year (October 2024), it rose by 1.48%. The average CPI from January to October increased by 1.74% compared to the same period last year. In October 2025, the Producer Price Index (PPI) increased by 0.01% compared to September, but decreased by 3.50% compared to the same month last year. The average PPI from January to October decreased by 1.71% compared to the same period last year.
- In September 2025, the total employment was 11.63 million people, a decrease of 11,000 or 0.10% compared to August. The number of unemployed people was 407,000, a decrease of 8,000 or 2.02% compared to the previous month. The number of people outside the labor force was 8.19 million, an increase of 10,000 or 0.13% from August. The labor force participation rate was 59.51%, a decrease of 0.07 percentage points from the previous month.
- In August 2025, the average regular salary for all employees (including both full-time and part-time workers, both local and foreign) was 48,098 NTD, a monthly increase of 0.41% and an annual increase of 2.92%. Non-regular salaries, such as bonuses and overtime, were 13,548 NTD. The total average salary, including both regular and non-regular components, was 61,646 NTD, a monthly decrease of 6.23% and an annual increase of 4.38%. The median regular salary was 38,507 NTD, a monthly increase of 0.54% and an annual increase of 2.66%.
Source: National Statistics, Republic of China (Taiwan)
● Statistics on Republic of China Nationals Traveling Abroad
| Outbound departures of nations in January –August 2025 12,610,662 |
| Year on Year +10.7% |
| Outbound departures of nations in August 2025 1,735,942 |
| Month on Month +0.1% |
Number of Trips and Growth Rate of Republic of China Nationals Traveling Abroad in July 2025 and from January to August 2025 –By Destination

★ Source: Ministry of the Interior, Immigration Office (Republic of China)
Note: The outbound travel data for Republic of China nationals is based on the principle of counting the first destination reached by flight. Additionally, factors such as irregular chartered flight itineraries are included. Therefore, for the actual data on Taiwanese nationals traveling to specific countries, please refer to the official inbound statistics published by each destination country.
● Number of Passengers on International Routes (Including Hong Kong and Macau) and Cross-Strait Routes at Taiwan Airports
| September, 2025 International routes (including Hong Kong and Macau) 3,865,999人 |
| Year on Year International routes (including Hong Kong and Macau) +4.1% |
| September, 2025 Cross-Strait Routes 473,259 |
| Year on Year Cross-Strait Routes +9.3% |
● Operational Overview of International and Cross-Strait Routes for National Airlines in September
In September, the six Taiwanese airlines carried a total of 2,432,054 passengers on international and cross-strait routes. Among them:
- EVA Air carried 944,359 passengers (accounting for 38.8%)
- China Airlines carried 814,808 passengers (33.5%)
- STARLUX Airlines carried 365,451 passengers (15.0%)
- Tigerair Taiwan carried 266,142 passengers (11.0%)
- The remaining two airlines, Mandarin Airlines and UNI Air, together carried 41,294 passengers (1.7%)
Source of the above information: Civil Aeronautics Administration, Ministry of Transportation and Communications –Civil Aviation Monthly Report
★ For complete information, please visit the following link.
https://www.caa.gov.tw/StatisticsYearMonthFile.aspx?a=1091&lang=1

Load Factor of Scheduled International and Cross-Strait
Flights at Airports in Taiwan
By Country and Airline Route

Island vacations remain highly popular! Check out the top island destinations and travel experiences all at once.
1. Overview
Observation Period: November 1, 2024 – September 30, 2025
Sources: Discussion forums, social media, news, blogs
Note: This online insight analysis is based on the OpView Social Media Database, focusing on online discussions related to island vacations.
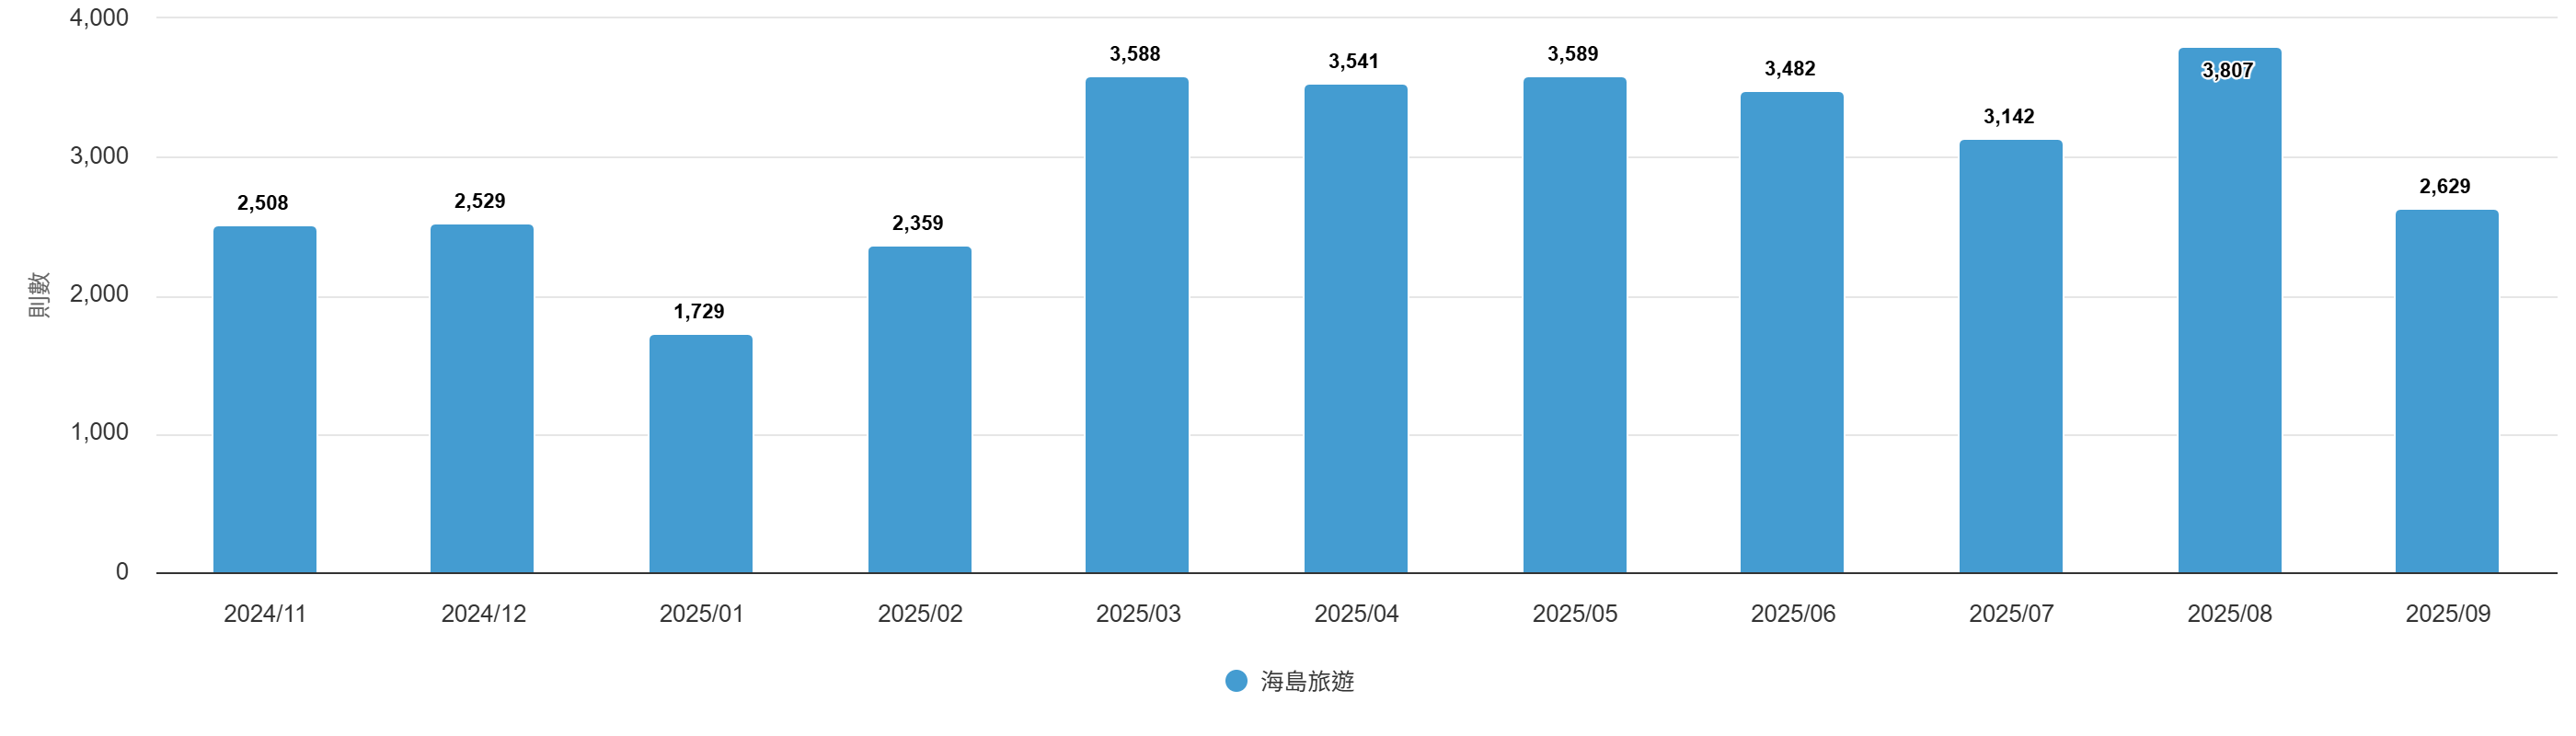
Statistical data shows that over the past year, online discussions about “island travel” have exhibited clear seasonal fluctuations, with a distinct peak during the summer months. Monthly online mentions ranged between 1,700 and 3,800, indicating steady long-term interest in the topic. The annual peak occurred in August 2025 (3,807 mentions), while the lowest point was in January 2025 (1,729 mentions). Overall, discussions began to rise in spring and reached their highest point in summer, reflecting the strong influence of seasonal climate and holiday factors on island travel trends.
Spring and summer (March–August) are the main peak seasons, with online discussions focusing on trip planning, airfare, accommodation, and water activities. Although online buzz declines in autumn and winter, some travelers still prefer “winter-escape island trips” to tropical destinations such as Thailand, Vietnam, or Indonesia. In spring, discussions tend to revolve around sightseeing and vacation planning, while in summer, the focus shifts to snorkeling, seaside hotels, and family or couple getaways. The peaks in online discussions about island travel are closely linked to school holidays, festivals, and weather patterns, showing that consumers continue to view such trips primarily as opportunities for relaxation, vacationing, and escaping the summer heat.
2. Insights into Online Buzz Sources
一、Distribution by source
Insights into online buzz sources from November, 2024 to September, 2025:
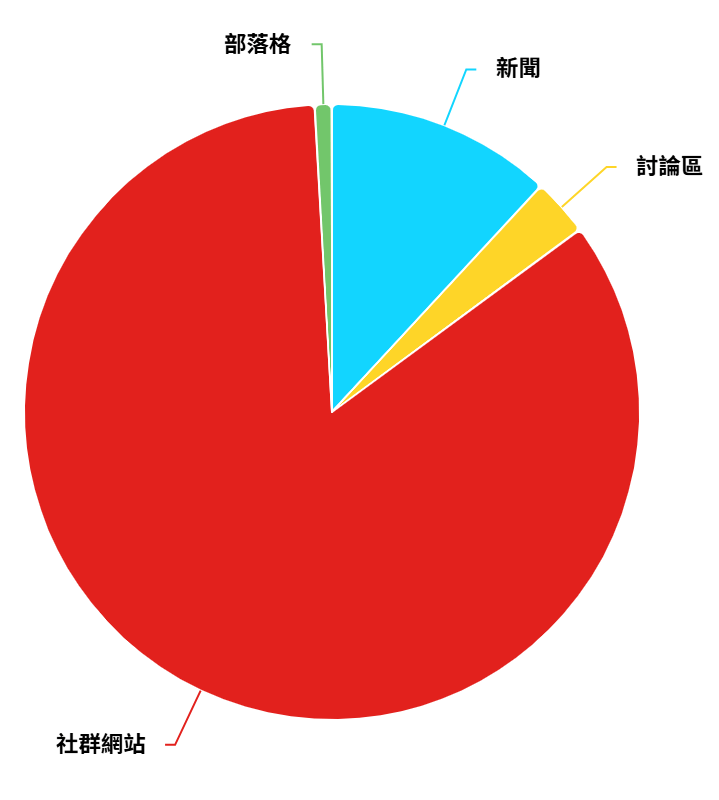
From the perspective of source composition, online discussions about island travel are primarily concentrated on social media (around 85%), followed by news outlets (about 10%) and forums (around 4%), while blogs account for less than 1%.
- Social media as the main communication channel:
Content types mainly include personal posts, photo sharing, and travel reviews, often highlighting scenic views, hotel unboxings, and itinerary planning.
Social engagement is high, with significantly more comments and shares compared to other sources, indicating that internet users tend to use social platforms for inspiration and travel value assessment. - News media as a supplementary information source:
Coverage mainly focuses on tourism bureau policies, new flight routes, and increases in tourist numbers, often through official or media reports.
Although the volume of mentions is relatively low, news content plays a key role in credibility building and shaping public awareness of island travel. - Forums and blogs as complementary sources:
Forums (such as PTT and Dcard) are mainly used for questions and advice exchanges, reflecting users’ information-gathering behavior before actual trips.
Blogs feature long-form content documenting detailed travel journals, accommodation reviews, and price comparisons, contributing significantly to search engine visibility.
二、Platform ranking overview

Based on an analysis of posts and discussions related to “island travel” over the past year, the top five platforms are as follows:
- Facebook Public Groups: Primarily focused on travel communities, island travel guides, and accommodation sharing. This is the main channel for discussion and information exchange.
- Facebook Pages (Fan Pages): Operated mainly by brands and KOLs, frequently featuring promotional content from hotels, airlines, and tourism organizations.
- Instagram: Centered on photos and short videos, with users sharing seaside views, poolscapes, and travel looks, showcasing strong visual appeal.
- Threads: An emerging platform in recent years where users tend to post real-time travel impressions. It is gradually becoming a new space for younger audiences to share travel experiences.
- YouTube: Focused on vlogs and travel guides, allowing viewers to visually explore island attractions and accommodations, offering high reference value.
Additionally, Dcard, LINE TODAY, Yahoo News, and PTT also maintain steady levels of discussion, indicating that island travel has evolved beyond a simple “leisure activity” to become a social lifestyle topic.
3. Gender Ratio and Interest Tags
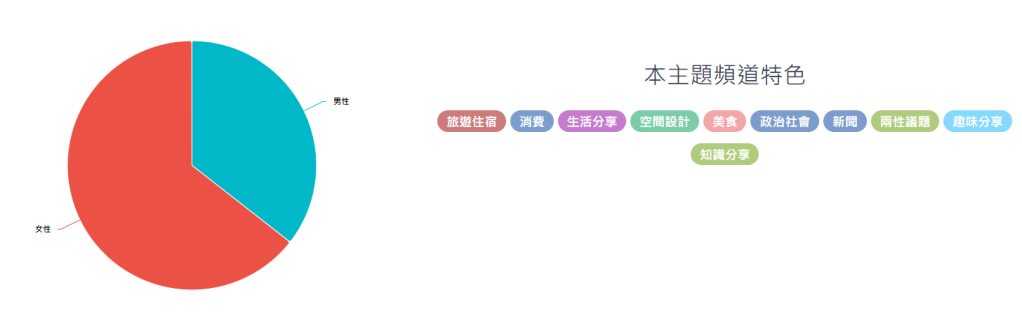
According to gender-based volume analysis, female users account for about 60%, while male users make up roughly 40%. This indicates that women show significantly higher engagement in island travel discussions, with content primarily centered on sharing experiences.
- Female posting tendencies:
Focus on accommodation, food, outfits, and photo spots as main discussion angles.Prefer content emphasizing aesthetic appeal, relaxation, and emotional healing, highlighting themes like “enjoying life” and a “dreamy atmosphere.” - Male posting tendencies:
Focus on activity experiences and practical travel information, such as diving gear, scooter or car rentals on islands, and flight comparisons.
From a topic-channel perspective, discussions are mainly concentrated in the following categories:
- Travel and accommodation (core topic)
- Lifestyle sharing, consumption, and food (extended topics)
- Interior design, knowledge sharing, and gender-related issues (supplementary topics)Overall, it is evident that users not only care about travel destinations, but also place strong emphasis on the overall travel quality and personal experience.
4. “Island Travel” Hot Keyword Insights –Word Cloud

一、Overall overview
From the word cloud, “island” emerges as the most central keyword, showing that discussions about island travel have maintained high online popularity over the past year. Related keywords such as “itinerary,” “free travel,” “hotel,” “beach,” “resort,” “honeymoon,” and “family” highlight consumers’ strong interest in leisure, travel planning, and accommodation experiences.
二、Thematic trend analysis
Based on the types and frequency of the keywords, the discussion topics can be categorized into the following main areas:
(1) Travel purposes and scenarios
Common keywords:
- honeymoon, family, free travel, day trip, group, guide, vacation, attraction, fun→ This indicates that the main target audiences for island travel are couples, newlyweds, family travelers, and independent tourists, emphasizing personalized and relaxing experiences.
(2) Locations and destinations
Frequently mentioned destinations:
- Okinawa, Phuket, Maldives, Bali, Ishigaki Island, Koh Samui, Malaysia, Indonesia, Thailand, Vietnam, Hokkaido→ Southeast Asian and Japanese islands are the most popular. Maldives and Phuket are viewed as luxury and dreamlike destinations, while Okinawa and Ishigaki Island are favored by Taiwanese travelers for their convenient access and suitability for short trips.
(3) Activities and experiences
Key terms:
- snorkeling, diving, ocean, beach, pool, sea luggage, animals, Green Island→ These keywords show consumers’ strong enthusiasm for water activities, natural ecology, and relaxation, reflecting a balance between leisure and adventure.
(4) Accommodation and facilities
Related terms:
- hotel, resort, Club Med, inn, lodging, pool, restaurant→ Discussions often center on accommodation quality and facility comprehensiveness. The frequent appearance of “Club Med” suggests that all-inclusive resorts are particularly appealing to online audiences.
(5) Consumer needs and impressions
Related terms:
- food, attractions, air tickets, flight routes, photos, videos, itineraries, fans, highlights→ Many discussions are accompanied by photo and video sharing, showing that island travel is closely intertwined with social media culture. Meanwhile, food remains one of the key attractions for travelers.

1. Taiwanese Travelers Flock Abroad! Over 10 Million Departures from January to July; Nearly 4 Million to Japan, Southeast Asia Travel Slows by 30%
From January to September this year, the number of visitors to Taiwan exceeded 6.05 million, a 9% increase compared to the same period last year. However, the tourism deficit has reached 8.05 million. Taiwanese travelers are eager to go abroad: according to the latest data from the Tourism Bureau, the top destinations from January to July remain Japan (35.6%) in first place and Mainland China (16.5%) in second.
Southeast Asia ranks fifth and sixth this year. Some travel industry operators noted that the Southeast Asian tourism market has slowed, with overall sales down by 30% compared to last year. This decline may be due to factors such as tariff impacts on consumer confidence, as well as regional issues like the Thailand-Cambodia border conflict and the Myanmar earthquake, making these destinations less likely to be chosen as top travel options.
2. “Bear Incidents” Spread Dampens Travel Intent to Japan! Foreign Tourists Uneasy, Travel Agencies Rushed to Reassure
Japan is currently in the peak autumn foliage and hiking season, but reports of bear sightings and attacks across various regions have cast a shadow over the travel atmosphere. Foreign tourists feel uneasy, and travel agencies are busy reassuring and responding to concerns. A survey targeting Japanese citizens also shows that about 80% of hikers are deeply worried about bear encounters. Some internet users have even posted on forums that they are considering temporarily canceling their travel plans.
According to Asahi TV, a Japanese tour operator stated that in the past, travelers mostly inquired about natural disasters such as tsunamis, earthquakes, or typhoons, and this is the first time they’ve received questions about bears. The operator explained that travel agencies first confirm the itinerary locations and then inform travelers that there is no risk of bear attacks in those areas, doing their best to ensure visitors feel safe.
3. Thailand’s Queen Mother Passes Away: Travel Taboos and 5 Key Reminders –Avoid Dressing Mistakes
Following the passing of Thailand’s Queen Mother, the country has entered a mourning period, but tourism operations remain stable. Most attractions and flights continue as usual, though entertainment activities are paused, and the atmosphere at music festivals and parties has cooled. Travelers planning to visit are advised to check itineraries and opening hours in advance and prioritize respect, ensuring a smooth trip guided by consideration and understanding.
It is recommended that travelers wear solid colors such as black, white, gray, or navy, avoiding bold prints and revealing cuts. This is not only to respect local customs but also to show deference. By embracing this subdued atmosphere, visitors are more likely to be appreciated by locals and can better experience the quiet beauty of Thailand during this period.
4. Taiwanese Outbound Travel Remains Strong, Tourism Deficit Hits Record High
According to the latest statistics from the Tourism Bureau, Ministry of Transportation and Communications, Taiwan’s tourism balance deficit for the first three quarters of 2025 reached NT$98 billion, marking a five-year high. Experts note that the outbound travel boom continues, with Taiwanese travelers spending an average of NT$52,000 per person abroad, while inbound visitor numbers have not yet fully recovered to pre-pandemic levels, causing the tourism deficit to continue expanding.
Data from the Tourism Bureau also shows that from January to September 2025, outbound departures exceeded 14.3 million, a 32% increase compared to the same period last year, indicating that the revenge travel trend is still ongoing. Popular destinations are mainly Japan, South Korea, Thailand, and Europe, with Japan alone accounting for 40% of all outbound travelers, the highest proportion ever recorded.
5. Japan May Raise Visa Fees as Early as Next Year; Taiwan Short-Term Visa Exemption Unaffected
Japan’s visa fees are currently lower compared to Europe and the U.S. The Japanese government plans to increase visa processing fees as early as 2026 to align with Western countries. Taiwanese travelers with short-term visa exemption are expected to be largely unaffected. However, Japan also plans to implement a pre-entry screening system for visa-exempt travelers, called the Japan Electronic Travel Authorization (JESTA), which may incur fees, though the details are still under consideration.
According to Nikkei and Asahi Shimbun, as the number of foreign visitors to Japan continues to rise, the government hopes that the increased costs of visa issuance will be reflected in the visa fees. They also expect that raising visa fees could help partially alleviate overtourism issues.
※CheeseAd is an advertising agency specializing in serving clients in the tourism industry. To better understand the current state of tourism in Taiwan for our foreign clients, we have selected news or information from your platform. If you have any comments regarding the above excerpts, please feel free to contact us. Thank you!

● Would You Pay for AI-Generated Content? Study Reveals: 52% of Online Articles Are AI-Created, but Google Still Prefers Human-Written Content
Since the rise of generative AI technology, a large volume of AI-generated content has appeared like mushrooms after rain, raising concerns that human-created content might be overshadowed. Recent research shows that AI now accounts for half of newly published articles over the past five years, contributing 52% of new content.
In its latest report, SEO consulting firm Graphite analyzed a random sample of 65,000 English articles published between January 2020 and May 2025. They found that in November 2024, the number of AI-generated articles temporarily surpassed human-written articles, marking a so-called “golden cross.”

Source: Future Commerce
https://fc.bnext.com.tw/articles/view/4186
● A Small Google Change Wiped Billions Off Reddit’s Market Value! What Is num=100 and How Does It Affect SEO?
Last month, Google removed the “num=100” parameter, which previously allowed users to view up to 100 results per search results page. With this change, the maximum number of websites displayed on page one dropped from 100 to 10, causing a significant stir in the SEO world.
This seemingly minor adjustment has huge implications: it reduces single-page visibility by nearly 90%, meaning fewer websites get exposure per search. Platforms like Reddit were particularly affected, as the number of times its content is cited by tools like ChatGPT sharply declined, contributing to a loss of billions in market value.

Source: Business Next
https://www.bnext.com.tw/article/84694/google-num-100-seo
● SEO Steps Down, GEO Steps In: How AI Search Is Rewriting the Content Battlefield and What It Means for Online Media
With the rise of AI-powered search, the way digital content is discovered is undergoing a major transformation. The era of traditional Search Engine Optimization (SEO) is declining, giving way to Generative Engine Optimization (GEO). When we enter a query into ChatGPT or Google’s AI search and receive a direct answer, what’s happening behind the scenes is that AI models gather vast amounts of relevant content from the web, then process and synthesize it using trained data and system prompts to generate a coherent response.

Source: Tech News
https://technews.tw/2025/10/23/as-seo-fades-and-geo-rises-ai-powered-search-redraws-the-content-battlefield-can-digital-media-survive/
● Meta to Use AI Chat Conversations for Ad Targeting, Effective Mid-December
Meta will soon utilize users’ conversations with its Meta AI chatbot to deliver more personalized posts, Reels, and ads. This policy is set to take effect on December 16, 2025.
Interactions on Facebook and Instagram –including posts, comments, Reels, and Stories –will inform how Meta adjusts ad delivery, ensuring content recommendations align with users’ evolving interests. Soon, engagement with Meta AI will serve as a new signal for improving content personalization and ad targeting.

Source: Tech News
https://technews.tw/2025/10/02/meta-will-begin-using-ai-chatbot-conversations-to-target-ads/
● The Brand Memory Battle in the AI Era: When AI Can Simulate Consumers, How Do You Create “Memorable” Marketing?
The essence of marketing has always been about understanding people. From early marketing funnel models (AARRR), CRM, CDP, to data-driven Segment Marketing, these tools help us accurately profile customers, predict behavior, and drive conversions. But all of this relies on collecting enough data. AI is now changing the rules of the game. Data is no longer just collected –it can be simulated. When AI can simulate consumers, the marketing landscape is being redefined, and the challenge shifts to not just targeting customers precisely, but also creating experiences and messages that leave a lasting, human “memory”.

Source: Future Commerce
https://fc.bnext.com.tw/articles/view/4185
● How Long Does a Social Media Post Live? YouTube Hits “Half-Life” in 9.7 Days, Facebook Only 81 Minutes
When you post on social media, how long is it actually visible to others? Research shows that a Facebook post reaches half of its total engagement just 81 minutes after being published.
With content constantly flooding social platforms, the lifespan of a single post is surprisingly short. Tech writer Scott Graffius shared a “half-life” analysis of posts across major social networks, revealing that for Facebook –the most used platform in Taiwan –a post’s half-life is only 81 minutes, while platforms like YouTube see much longer engagement periods, averaging 9.7 days.

Source: Business Next
https://www.bnext.com.tw/article/84499/social-media-half-life

2026 Tigerair Taiwan Calendar Concept
Brand introduction:
Tigerair Taiwan is the first and only low-cost carrier (LCC) of Taiwan, proudly Taiwanese.
Since its establishment, Tigerair Taiwan has operated under the principle of “safety first”, delivering travel experiences with the corporate spirit of passion, warmth, and sincerity.
Tigerair Taiwan’s goal is to provide passengers with convenient, flexible, and diverse travel options, ensuring that every boarding experience is a delightful one.
From its early cautious beginnings, Tigerair Taiwan has always upheld its corporate values, actively expanded its Asia-Pacific routes, and gradually established itself as a leading low-cost airline, becoming the top choice for many travelers.
Creative Concept:
As Taiwan’s leading LCC, every team member –pilots, cabin crew, airport counter staff, and ground operations personnel –remains dedicated to their post.
All this effort is to allow passengers to explore each city boldly, passionately, and playfully.
Slogan Concept:
“Tigerair Taiwan –Play Big, Play Bold in Every City”
2026 Tigerair Taiwan Calendar


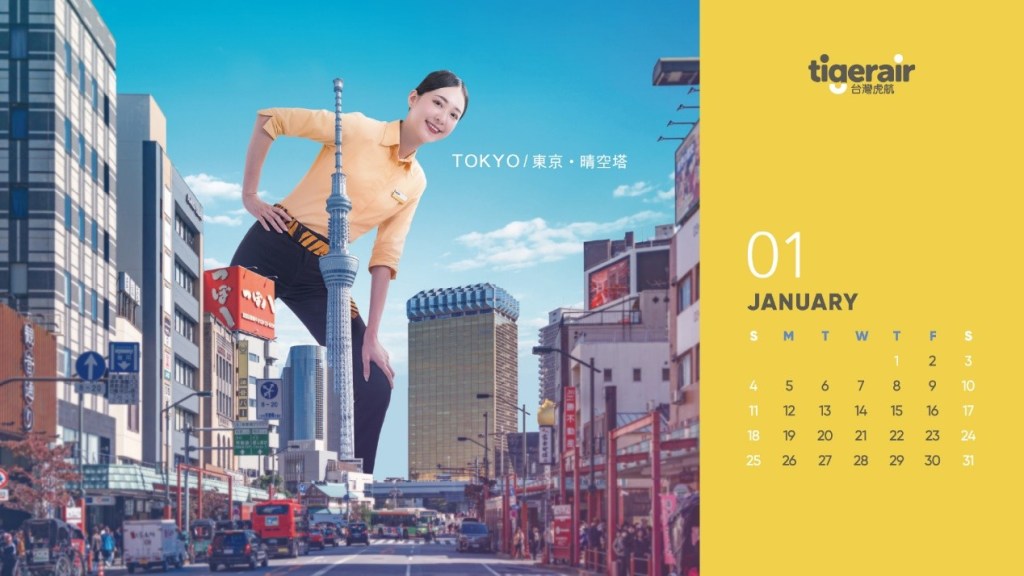
Cover: Featuring Tigerair Taiwan crew members to welcome 2026 with warmth and energy.

January – Tokyo Skytree (Tokyo)
February – Inawashiro Flower Garden (Fukushima)

March – Kaohsiung Music Center (Kaohsiung)

April – Monet Garden (Kochi)

May – Tottori Sand Dunes (Tottori)

June – Korakuen Garden (Okayama)

July – Stone Grandpa Statue (Jeju)

August – Dragon Bridge (Da Nang)

September – Taipei 101 (Taipei)

October – Kiyotsu Gorge (Niigata)

November – Hot Air Balloon Festival (Saga)

December – Kakunodate Samurai Residences (Akita)

Animated version of the calendar for social media exposure on Tigerair Taiwan’s official Facebook page.
https://www.facebook.com/share/v/17L2jFi79p/

