● Key Economic Indicators of Taiwan (Data released before May 6th, 2026)
 GDP Economic Growth Rate (yoy) 7.71 (%) 2026 forecast |
 CPI Change Rate (yoy) 1.20 (%) Mar. 2026 |
 Unemployment Rate 3.34 (%) Mar. 2026 |
 Monthly Regular Earnings of All Employees (Industry and Services) 48,494 (NT dollars) Feb. 2026 |
- In March 2026, the Consumer Price Index (CPI) decreased by 0.51% compared to the previous month (February), and rose by 0.19% after seasonal adjustment. It increased by 1.20% compared to the same month last year (2025). The average CPI for January to March rose by 1.23% compared to the same period last year. The Producer Price Index (PPI) in March rose by 3.59% compared to the previous month, but rose by 2.53% compared to the same month last year. The average PPI for January to March increased by 0.17% compared to the same period last year.
- In March 2026, the number of employed persons was 11,638,000, a decrease of 6,000 or 0.05% from the previous month. The number of unemployed persons was 402,000, an increase of 2,000 or 0.55% from the previous month. The labor force participation rate in March was 59.57%, down by 0.02 percentage points from the previous month. The unemployment rate in March was 3.34%; the seasonally adjusted unemployment rate was 3.35%, an increase of 0.02 percentage points from the previous month.
- In February 2026, the average regular earnings for full-time domestic employees in the industrial and service sectors was NT$51,390, a month-on-month decrease of 0.61% and a year-on-year increase of 2.76%. Non-regular earnings, including bonuses and overtime pay, reached NT$54,719. Combined, the average total earnings stood at NT$106,109, representing a monthly increase of 35.35% and a yearly increase of 72.84%. This significant growth was primarily due to the timing of the Lunar New Year (which fell in February this year, compared to January in 2025), leading to a higher concentration of year-end bonus payments. The median regular earnings was NT$40,729, with a monthly decrease of 0.72% and a yearly increase of 2.64%.
Source: National Statistics, Republic of China (Taiwan)
● Statistics on Republic of China Nationals Traveling Abroad
| Outbound departures of nations in January – March 2026 5,365,205 |
| Year on Year +19.4% |
| Outbound departures of nations in March 2026 1,771,921 |
| Month on Month -3.1% |
115年1月中華民國國民出國人次及成長率-按目的地分
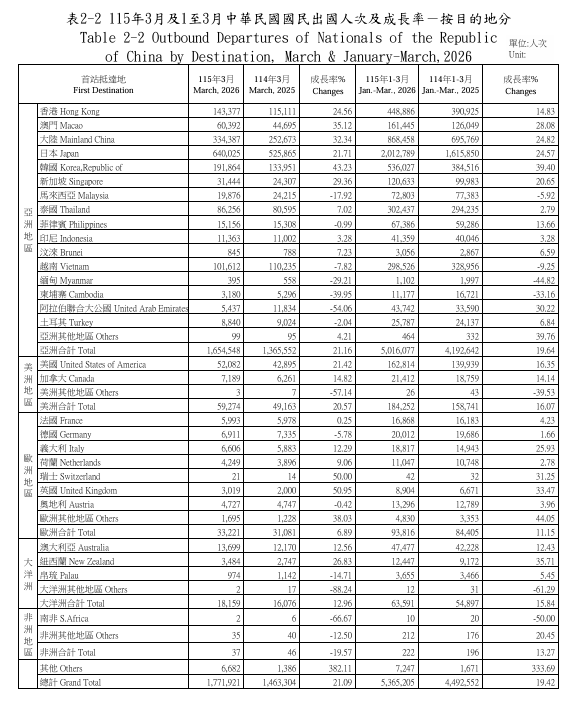
★Source: Ministry of the Interior, Immigration Office (Republic of China)
Note: The outbound travel data for Republic of China nationals is based on the principle of counting the first destination reached by flight. Additionally, factors such as irregular chartered flight itineraries are included. Therefore, for the actual data on Taiwanese nationals traveling to specific countries, please refer to the official inbound statistics published by each destination country.
● Number of Passengers on International Routes (Including Hong Kong and Macau) and Cross-Strait Routes at Taiwan Airports
| February, 2026 International routes (including Hong Kong and Macau) 4,774,461 |
| Year on YearInternational routes (including Hong Kong and Macau) +15.9% |
| February, 2026 Cross-Strait Routes 451,634 |
| Year on Year Cross-Strait Routes +49.6% |
● February Operations Overview: International and Cross-Strait Routes of National Airlines
In February, the total passenger volume for international and cross-strait routes across the six national airlines reached 2,909,425. Among them,
- EVA Air: 1,164,317 passengers (40.0%)
- China Airlines: 955,987 passengers (32.9%)
- STARLUX Airlines: 466,020 passengers (16.0%)
- Tigerair Taiwan: 278,797 passengers (9.6%)
- Mandarin Airlines and UNI Air: a combined total of 44,304 passengers (1.5%).
Source of the above information: Civil Aeronautics Administration, Ministry of Transportation and Communications –Civil Aviation Monthly Report|
★For complete information
https://www.caa.gov.tw/StatisticsYearMonthFile.aspx?a=1091&lang=1

Load Factor of Scheduled International and Cross-Strait
Flights at Airports in Taiwan
By Country and Airline Route

1.Record-High Outbound Travel: “Dual-Destination” Trips Become Mainstream
Outbound travel momentum among Taiwanese citizens continues to expand. According to recent statistics, outbound trips reached 5,365,205 in the first quarter of this year, a year-on-year increase of 19.42%, setting a record high for the same period. Conversely, inbound tourists to Taiwan totaled 2,232,044, a year-on-year growth of 4.85%, indicating that the recovery of inbound tourism still needs strengthening. Travel operators have observed that the growth rate of “Dual-Destination” travel patterns is more than double that of traditional single-destination trips. Combining multiple rhythms and experiences into a single journey has now become a mainstream preference for travelers.
2.Looming Global Jet Fuel Shortage Crisis: Summer Travel Costs Expected to Surge
Claudio Galimberti, Chief Economist at Rystad Energy, points out that multiple regions worldwide will face aviation fuel shortages in the coming weeks. He stated that since the onset of the crisis, the global trade supply of jet fuel has decreased by approximately 40%, with the majority of these fuels being refined in the Middle East. Specifically, flight cancellations in Southeast Asia may evolve from sporadic incidents into a systemic norm. Furthermore, California in the United States, which imports a significant portion of its fuel from Asia, is likely to feel the impact shortly thereafter.
3.Travel Alert! New Tourist Taxes to be Implemented Across Southeast Asia, Japan, and Europe in 2026
In recent years, many popular tourist cities worldwide have grappled with over-tourism and the resulting strain on public services. In response, several regions have begun planning tourist tax systems. Starting in 2026, various destinations across Southeast Asia, Japan, and Europe will implement new tourist taxes or increase current rates, which is bound to raise the overall cost of international travel.
In Japan, the city of Kyoto will adjust its accommodation tax starting in March 2026, with rates tiered based on room prices. While taxes for low-cost accommodations will see a slight uptick, rates for mid-to-high-priced stays will double. The most significant adjustments apply to luxury accommodations, with the highest tier reaching 10,000 yen per night. The Kyoto city government estimates that this new system will generate over 10 billion yen in annual tax revenue, which will be allocated toward city maintenance and tourism management.
4.Taiwanese Travelers Top Spending in Japan for Q1 2026; Chinese Tourist Spending Drops 50.4%
The Japan Tourism Agency (JTA) announced today that the total estimated spending by foreign visitors in Japan from January to March 2026 reached 2.3378 trillion yen (approx. NT$465.1 billion), a 2.5% increase compared to the same period last year. Taiwanese travelers emerged as the top spenders, contributing 388.4 billion yen (approx. NT$77.2 billion), accounting for 16.6% of the total.
According to the “Consumption Trend Survey of Foreign Visitors to Japan,” the highest spending in the first quarter of 2026 came from Taiwan (388.4 billion yen), followed by South Korea (318.2 billion yen) in second place, China (271.5 billion yen) in third, the United States (259.2 billion yen) in fourth, and Hong Kong (148.2 billion yen) in fifth.
5.The “Bali Alternative”! Australian Travel Site Names Vietnam’s Phu Quoc as Southeast Asia’s New Favorite
As “Bali Alternatives” becomes a trending search term, Vietnam’s Phu Quoc Island is quietly taking center stage. The renowned Australian travel website Escape recently highly recommended Phu Quoc in its list of the “Best Alternatives to Bali,” describing it as one of Southeast Asia’s brightest rising stars, blending affordable costs, breathtaking scenery, and diverse experiences.
For travelers who love tropical beaches, Phu Quoc offers the same elements that originally made Bali so attractive: stretching white sands, turquoise waters, and a laid-back pace. Whether it is Khem Beach, Sao Beach, or the pristine coastline at the southern tip of the island, most areas still retain their natural and pure charm. The island also features a native forest ecosystem and jungle hiking trails, making it ideal for travelers seeking adventure.
※CheeseAd is an advertising agency specializing in serving clients in the tourism industry. To better understand the current state of tourism in Taiwan for our foreign clients, we have selected news or information from your platform. If you have any comments regarding the above excerpts, please feel free to contact us. Thank you!

● Search Algorithm Update! Google Cracks Down on GBP Keyword Stuffing; AI Overviews Become Key to Rankings
Google launched a major update to its Local SEO algorithms in 2026, targeting a crackdown on spam content within Google Business Profiles (GBP) while expanding the integration of AI Overviews in search results. This transformation is forcing small businesses in the United States to rethink their online visibility strategies and offers crucial insights for digital marketers and SMEs in Taiwan.

Source: LIFE
https://life.tw/?app=view&no=3010073
● 2026 Short Video Trends Unveiled: How Businesses Achieve Precise Monetization via Short Video Marketing
As TikTok, Instagram Reels, and YouTube Shorts become the digital domains where global internet users spend the most time, every brand has recognized the importance of short video marketing. However, the market’s harsh reality is that as every brand dives into short-form content, audience attention has become extremely scarce. The “Traffic Dividend Era” –where simply following a dance trend or lip-syncing could garner millions of views –has officially come to an end.
In the face of increasingly stringent algorithms and “ad fatigue” among consumers, where exactly are future short video trends headed? How can businesses avoid the pitfall of “spending heavily on videos with zero conversions”? This article provides a deep dive into the underlying logic of the 2026 short video market and brings you practical insights from industry experts.

Source: Marketers Go
https://www.marketersgo.com/cases/202604/26shorttrend/
● Highly Anticipated! XChat Debuts on Apple Store with New Features Revealed
XChat, the “Super App” from Elon Musk’s X platform, was originally scheduled to land on the Apple Store on the 17th but faced an unannounced delay, though pre-orders remained open for iPhone users. After a six-day wait, it officially launched today (the 23rd). Notably, the app was released simultaneously in China with simplified Chinese support, clearly positioning itself as a direct competitor to WeChat. XChat integrates social networking, content, and financial payment services, earning it the nickname “The Western WeChat.” However, unlike its Asian rivals, Musk’s version emphasizes privacy protection as its key selling point, featuring “completely ad-free usage, login without a phone number, message editing, and self-destructing messages (burn-after-reading).”

● AnyMind Group Launches AnyDigital Max: Leveraging AI and UGC to Combat Ad Fatigue and Maximize ROAS
As marketing campaigns grow increasingly complex, advertisers continue to face significant challenges in creating high-performance creative assets. Concurrently, consumers are constantly exposed to repetitive branded content, leading to a prominent phenomenon known as “ad fatigue,” which gradually diminishes the cost-effectiveness of ad placements.
On the other hand, brands are increasingly leveraging influencer and creator-generated content to boost engagement and conversion rates. It is projected that investment in creator and influencer content across the Asia-Pacific (APAC) region will continue to grow through 2026. In recent years, the nature of influencer content has undergone a noticeable shift, with marketers moving away from “brand awareness” oriented strategies toward campaigns that emphasize “actual performance.”

Source: AnyMind
https://anymindgroup.com/tw/news/press-release/anydigitalmax_launch
● [2026 Subscription App Insights] Shorter Free Trials, Lower Conversion? Decoding Profitability Keys from 1 Billion Transactions
While AI has leveled the playing field for app development, the difficulty of making a profit hasn’t decreased; instead, it has become more concentrated among a few key players. Building a software product is no longer the primary challenge –the real battlefield lies in “how to keep users paying.”
Subscription data platform RevenueCat has released its State of Subscription Apps 2026 report. By analyzing a massive database of underlying operational records, the report provides an objective examination of the “monetization health” of modern digital products.

Source: Tech Orange
https://techorange.com/2026/04/18/state-of-subscription-apps/

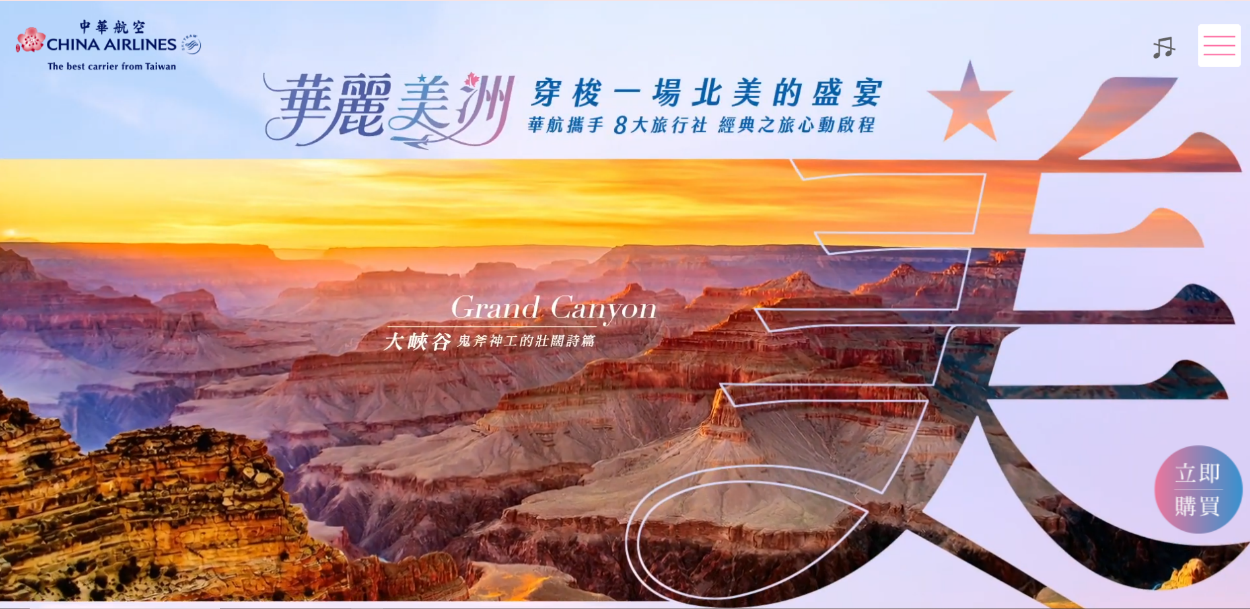
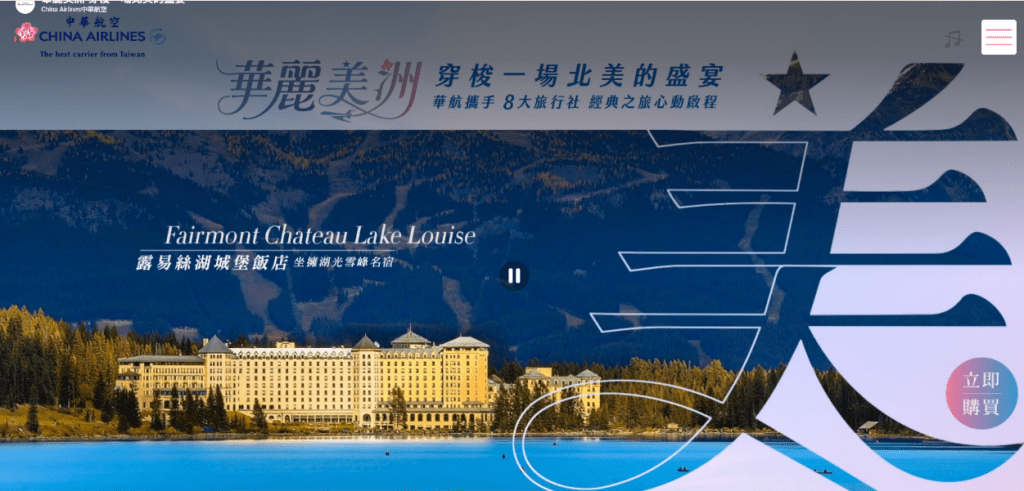
Splendid America PAK
Brand Concept:
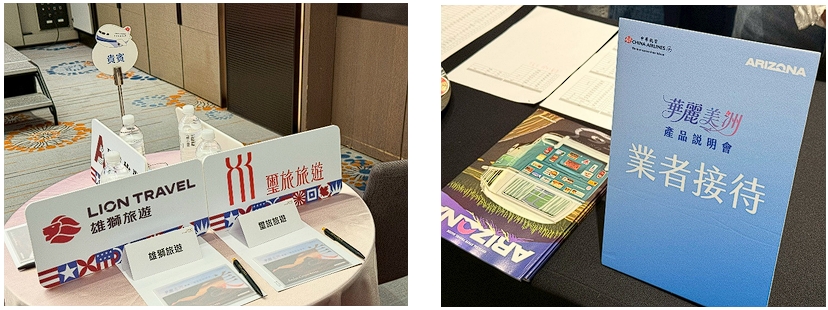
With China Airlines’ direct flights to 7 major North American gateways –Vancouver, Seattle, San Francisco, Los Angeles, Ontario, Phoenix, and New York –we have collaborated with 8 leading travel agencies to leverage our flight network and curate the premier group travel brand: “Splendid America.”
Following the core philosophy of the Splendid series –“Turning the places you long for into the paths you have walked” –we have handpicked the most iconic and awe-inspiring American journeys. Embark on an exploration that spans majestic nature and classic urban landscapes aboard our brand-new, ultra-comfortable A350 aircraft. Experience the signature aesthetics of master designer Ray Chen and indulge in Michelin-starred feasts throughout your journey.
“Splendid America: Weave through a feast of North American wonders.”
Landing page

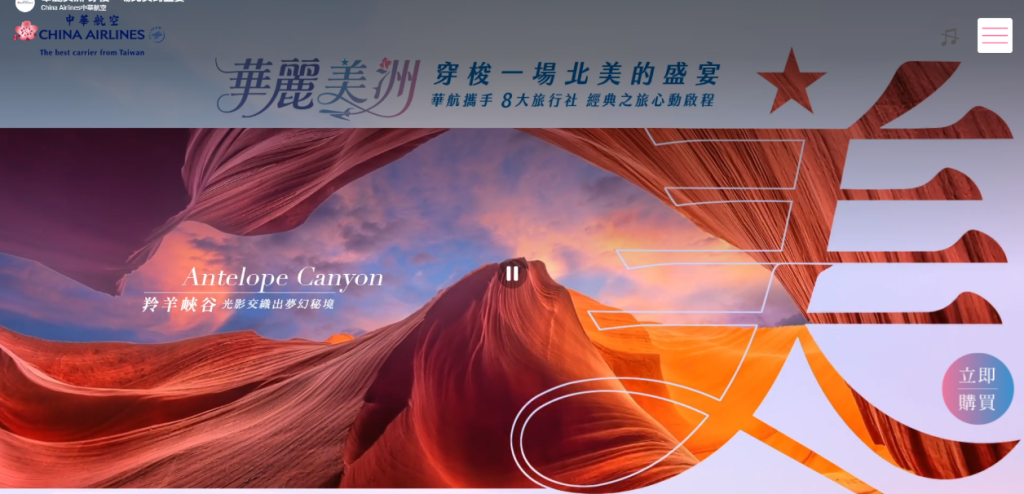
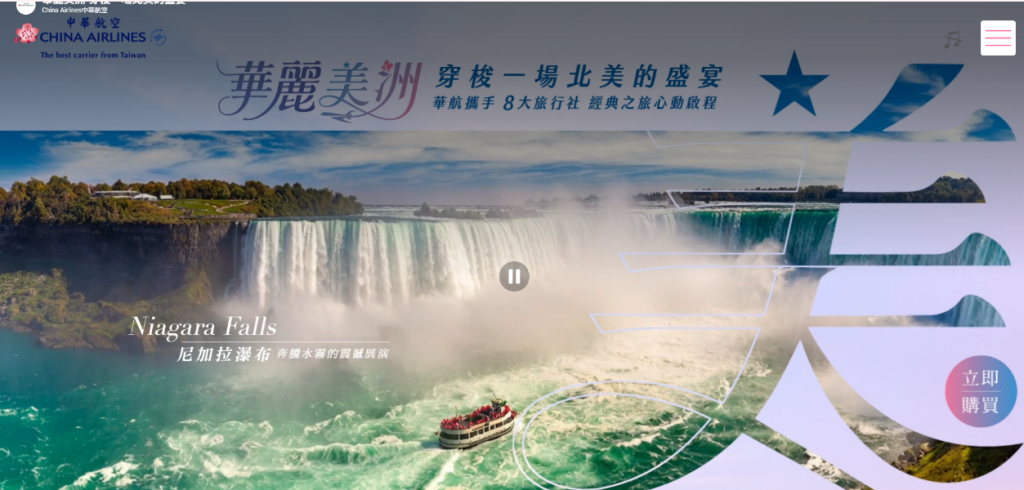
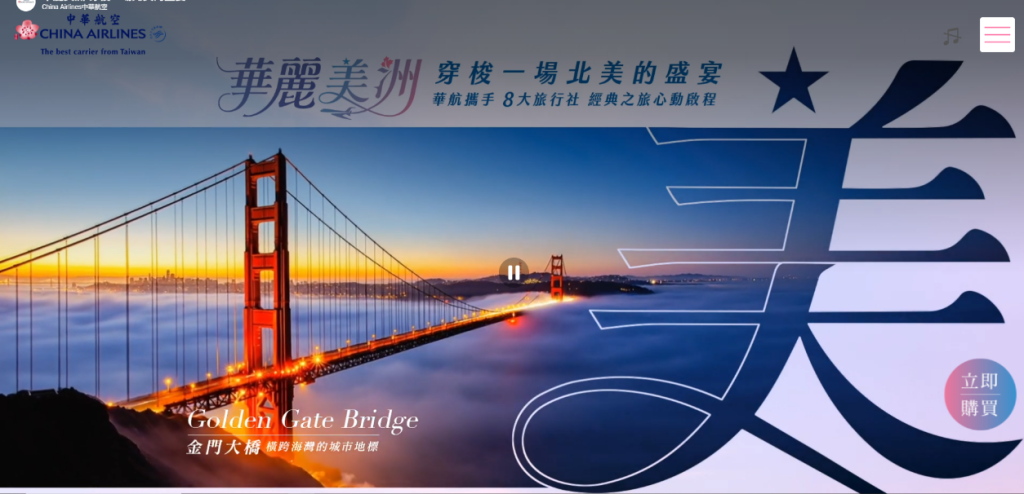
Opening Animation: Aesthetic Visuals Representing Splendid Landscapes
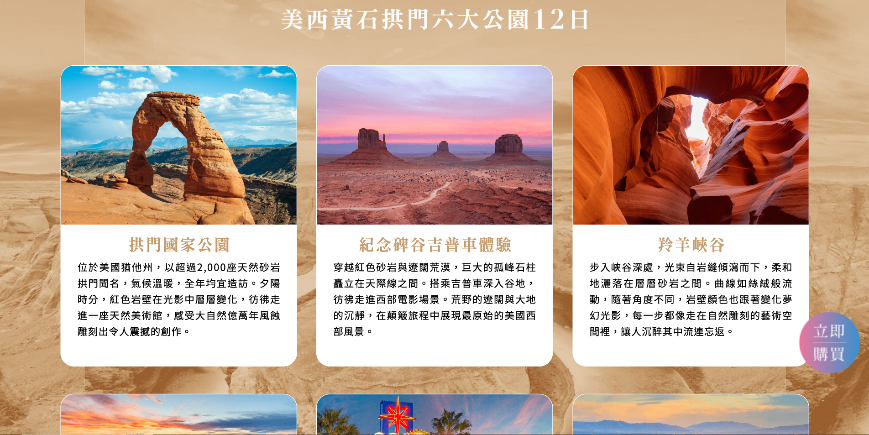
Grand Canyon: An epic poem of majestic, divine craftsmanship
Antelope Canyon: A dreamlike sanctuary woven by light and shadow
Niagara Falls: A breathtaking performance of thundering mist
Golden Gate Bridge: An iconic urban landmark spanning the bay
Fairmont Chateau Lake Louise: A prestigious retreat nestled amidst glacial lakes and snowy peaks
Product Sales Page (Itineraries)
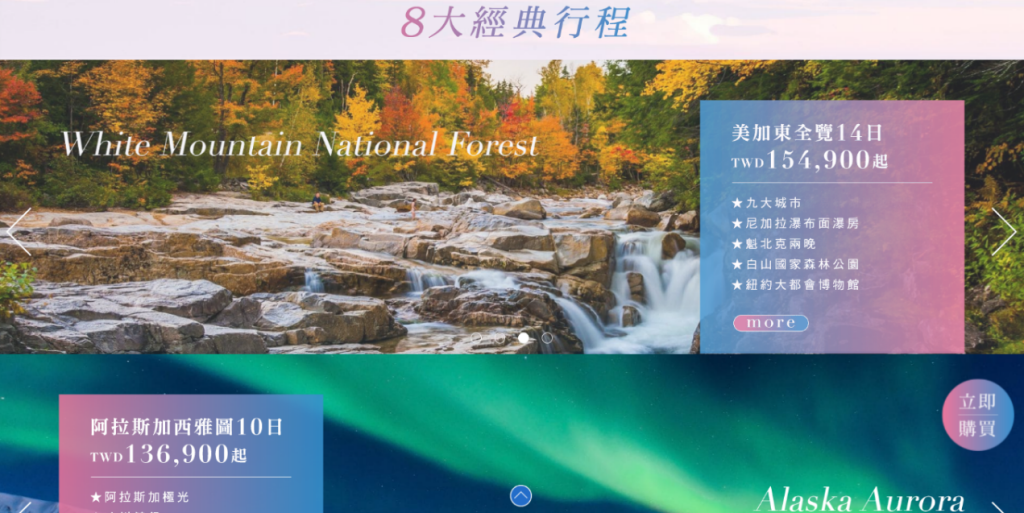
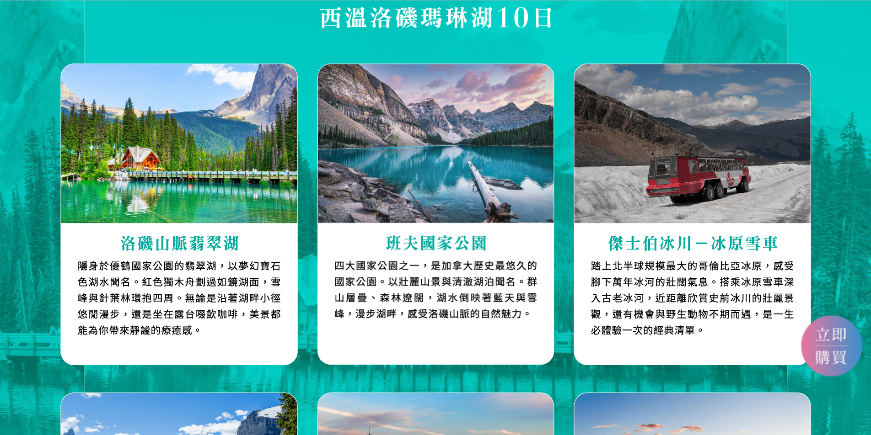
Western Canada & Rockies –Maligne Lake (10 Days)
Best of West America –Yellowstone, Arches & 6 Major National Parks (12 Days)
Grand Tour of Eastern US & Canada (14 Days)

Digital Advertising
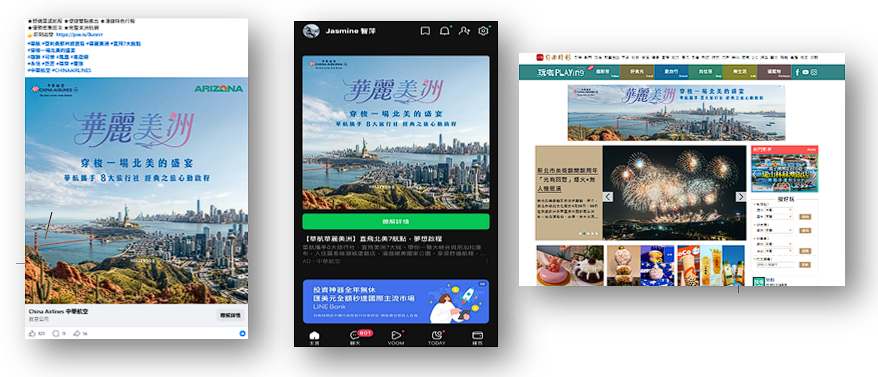
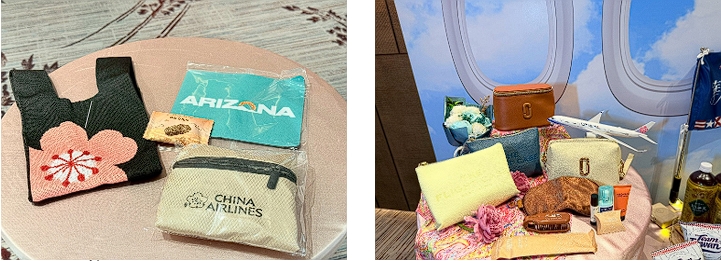
Splendid America: Exclusive Product Seminar


On-site Decorations & Displays